The Gaussian Linking Number (GLN) is another measure of entanglement between a pair of chromosomes. It indicates how many times (and in which direction) one chromosome winds around the other one. There are two main reasons to evaluate GLN:
A definition of a linking number between two closed curves in 3 dimensions (e.g. gamma 1 and gamma 2) is given by the Gauss double integral, Eq. 1.
In the case of chromosomes, chains become collections of points, i.e. positions of beads (base pairs), and the integrals may be replaced by a sum over segments. We can relax the requirement to have basic integer indicators for linking and we perform the double Gauss discrete integral over open chains. Gauss proved that for closed curves this integral is always integer, which is an invariant up to isotopies, and it indicates how many times one curve winds around the second one. Thus the Gauss discrete integral over the open chains takes the form:
Using the following methods, introduced by us for proteins in [1], we analyze the following four quantities for each pair of chromosomes:
We distinguish the directions of windings with respect to the natural direction of chromosome chains from 5' to 3'. Thus a high maxGLN or low minGLN indicate that corresponding part of the chromosome significantly winds around a loop in a "positive" or "negative" direction, respectively. A high max|GLN| combines those two cases and thus indicates a significant winding in any direction. Note that if two chromosomes are linked the identified subchains via the max short |GLN| method are significantly shorter than the subchains determined via max|GLN| method, e.g. see Fig. 1. When chromosomes are unlinked, subchains identified via maxshort|GLN| method are still rather long in the comparison to these identified via the max|GLN| method, e.g. see Fig. 1. Comparison of subchains determined based on max and maxshort|GLN| provides additional descriptor to distinguish between linked and unlinked chromosomes.
Fig. 1 An example of entanglement analysis of a pair of chromosomes based on max and max short |GLN| method. (A) Chromosomes a and d (model 1) from [1], whGLN: 0.37, max and max short|GLN| respectively 1.01 and 0.85, for identified subchains of chromosome a: 432-1425 (red) and 432-1425 (red, the range of this subchain did not change); chromosome d: 308-1372 (blue) and 839-1371 (cyan). These chromosomes are unlinked. (B) Chromosomes a and c from (model 1) [1], whGLN: 1, max and max short |GLN| respectively 2.55 and 2.09 for identified subchains of chromosomes a: 762,1212 (red) and 762-1212 (red); chromosome c: 170-1469 (blue) and 1368-1450 (cyan). These chromosomes are unlinked. (C) Chromosome a and h (model 1) from [1], whGLN: -1.77, max and max short|GLN| respectively -2.72 and -2.51, for identified subchains of chromosome a: 674-1394 (red) and 674-1394 (red, the range of this subchain did not change); chromosome h: 309-525 (blue) and 367-421 (cyan). These chromosomes are linked. Note a significant decrease in the length of subchain in the case of chromosome h. (D) Chromosome a and n (model 1) from [1], whGLN: -0.7, max and max short|GLN| respectively -1.55 and -1.36, for identified subchains of chromosome a: 357-767 (red) and 357,767 (red, the range of this subchain did not change); chromosome n: 11-358 (blue) and 172-259 (cyan). These chromosomes are linked. Note a significant decrease in the length of subchain in the case of chromosome n.
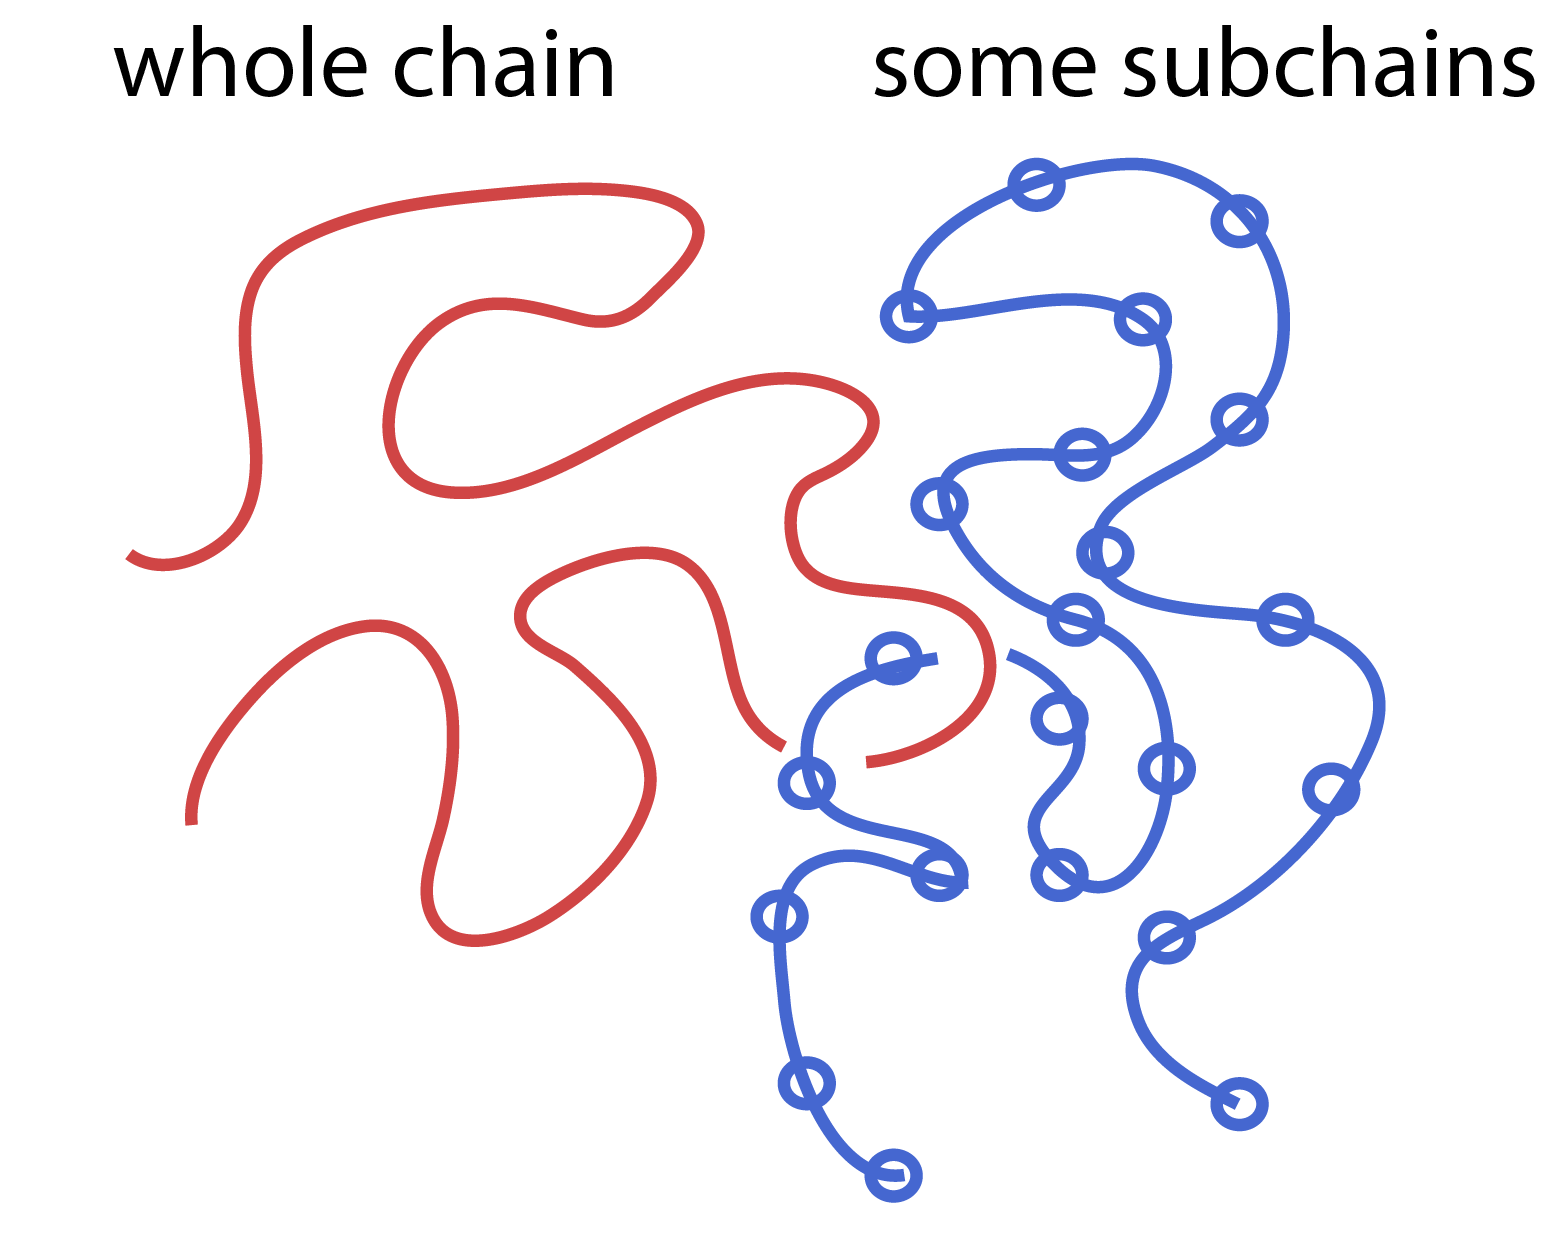
Fig. 2 Sketch of a method to determine max|GLN| between chain 1 and all subchains of chain 2.
The GLN can be help to distinguish between linked and unlinked pair of chromosomes, especially when the determined polynomial is classified as Other. Other has two meanings: a pair of chromosomes is linked in a very complex manner, or chromosomes are unlinked, but each of them possesses a complex knot. Figure 3 presents an example of linked chromosomes – pair e and n (Cell 1, model 1, [2]). In this case whGLN=2.88 and max|GLN| =3.38, strongly suggesting that they are linked. The highest value of max|GLN| is found for the following subchains chain e: 35-946, chain n: 25-895. These fragments are rather broad. A more precise location of winding is provided for users using the additional local search (as described above) over the winding fragments. Application of the first round of the method described here gives max|GLN|=3.31 for chain e: 35-333 and chain n: 25-370. The values of min and max GLN are presented on matrices in Fig. 4. The method saturates for max|GLN|=2.76 for chain e: 53-320 and chain n: 170-200 (this fragment consists only of 30 beads). With adequate coloring of subchains it is now possible to see, even by a naked eye, that these chromosomes are linked.
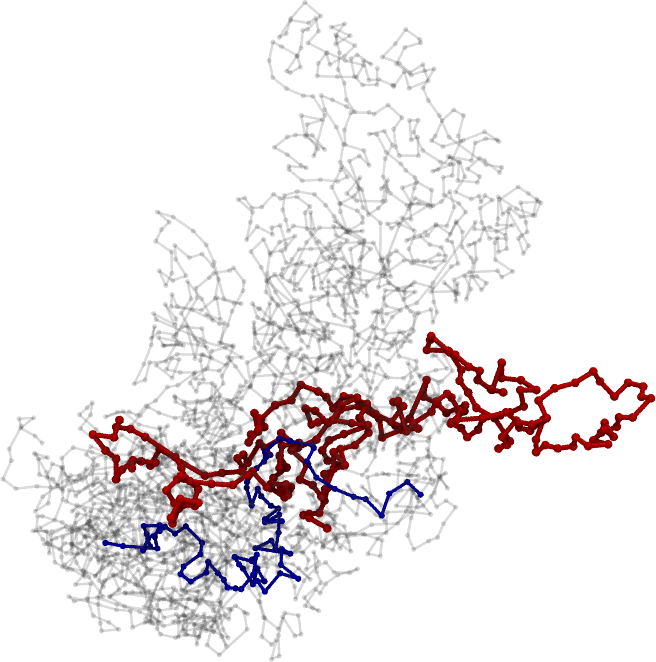
Fig. 3 GLN can be used to identify the shortest fragments of chromosomes which wind around each other. These fragments in chromosomes n and e are indicated with red and blue color, left panel. Mechanical smoothing of the same chromosomes right panel.
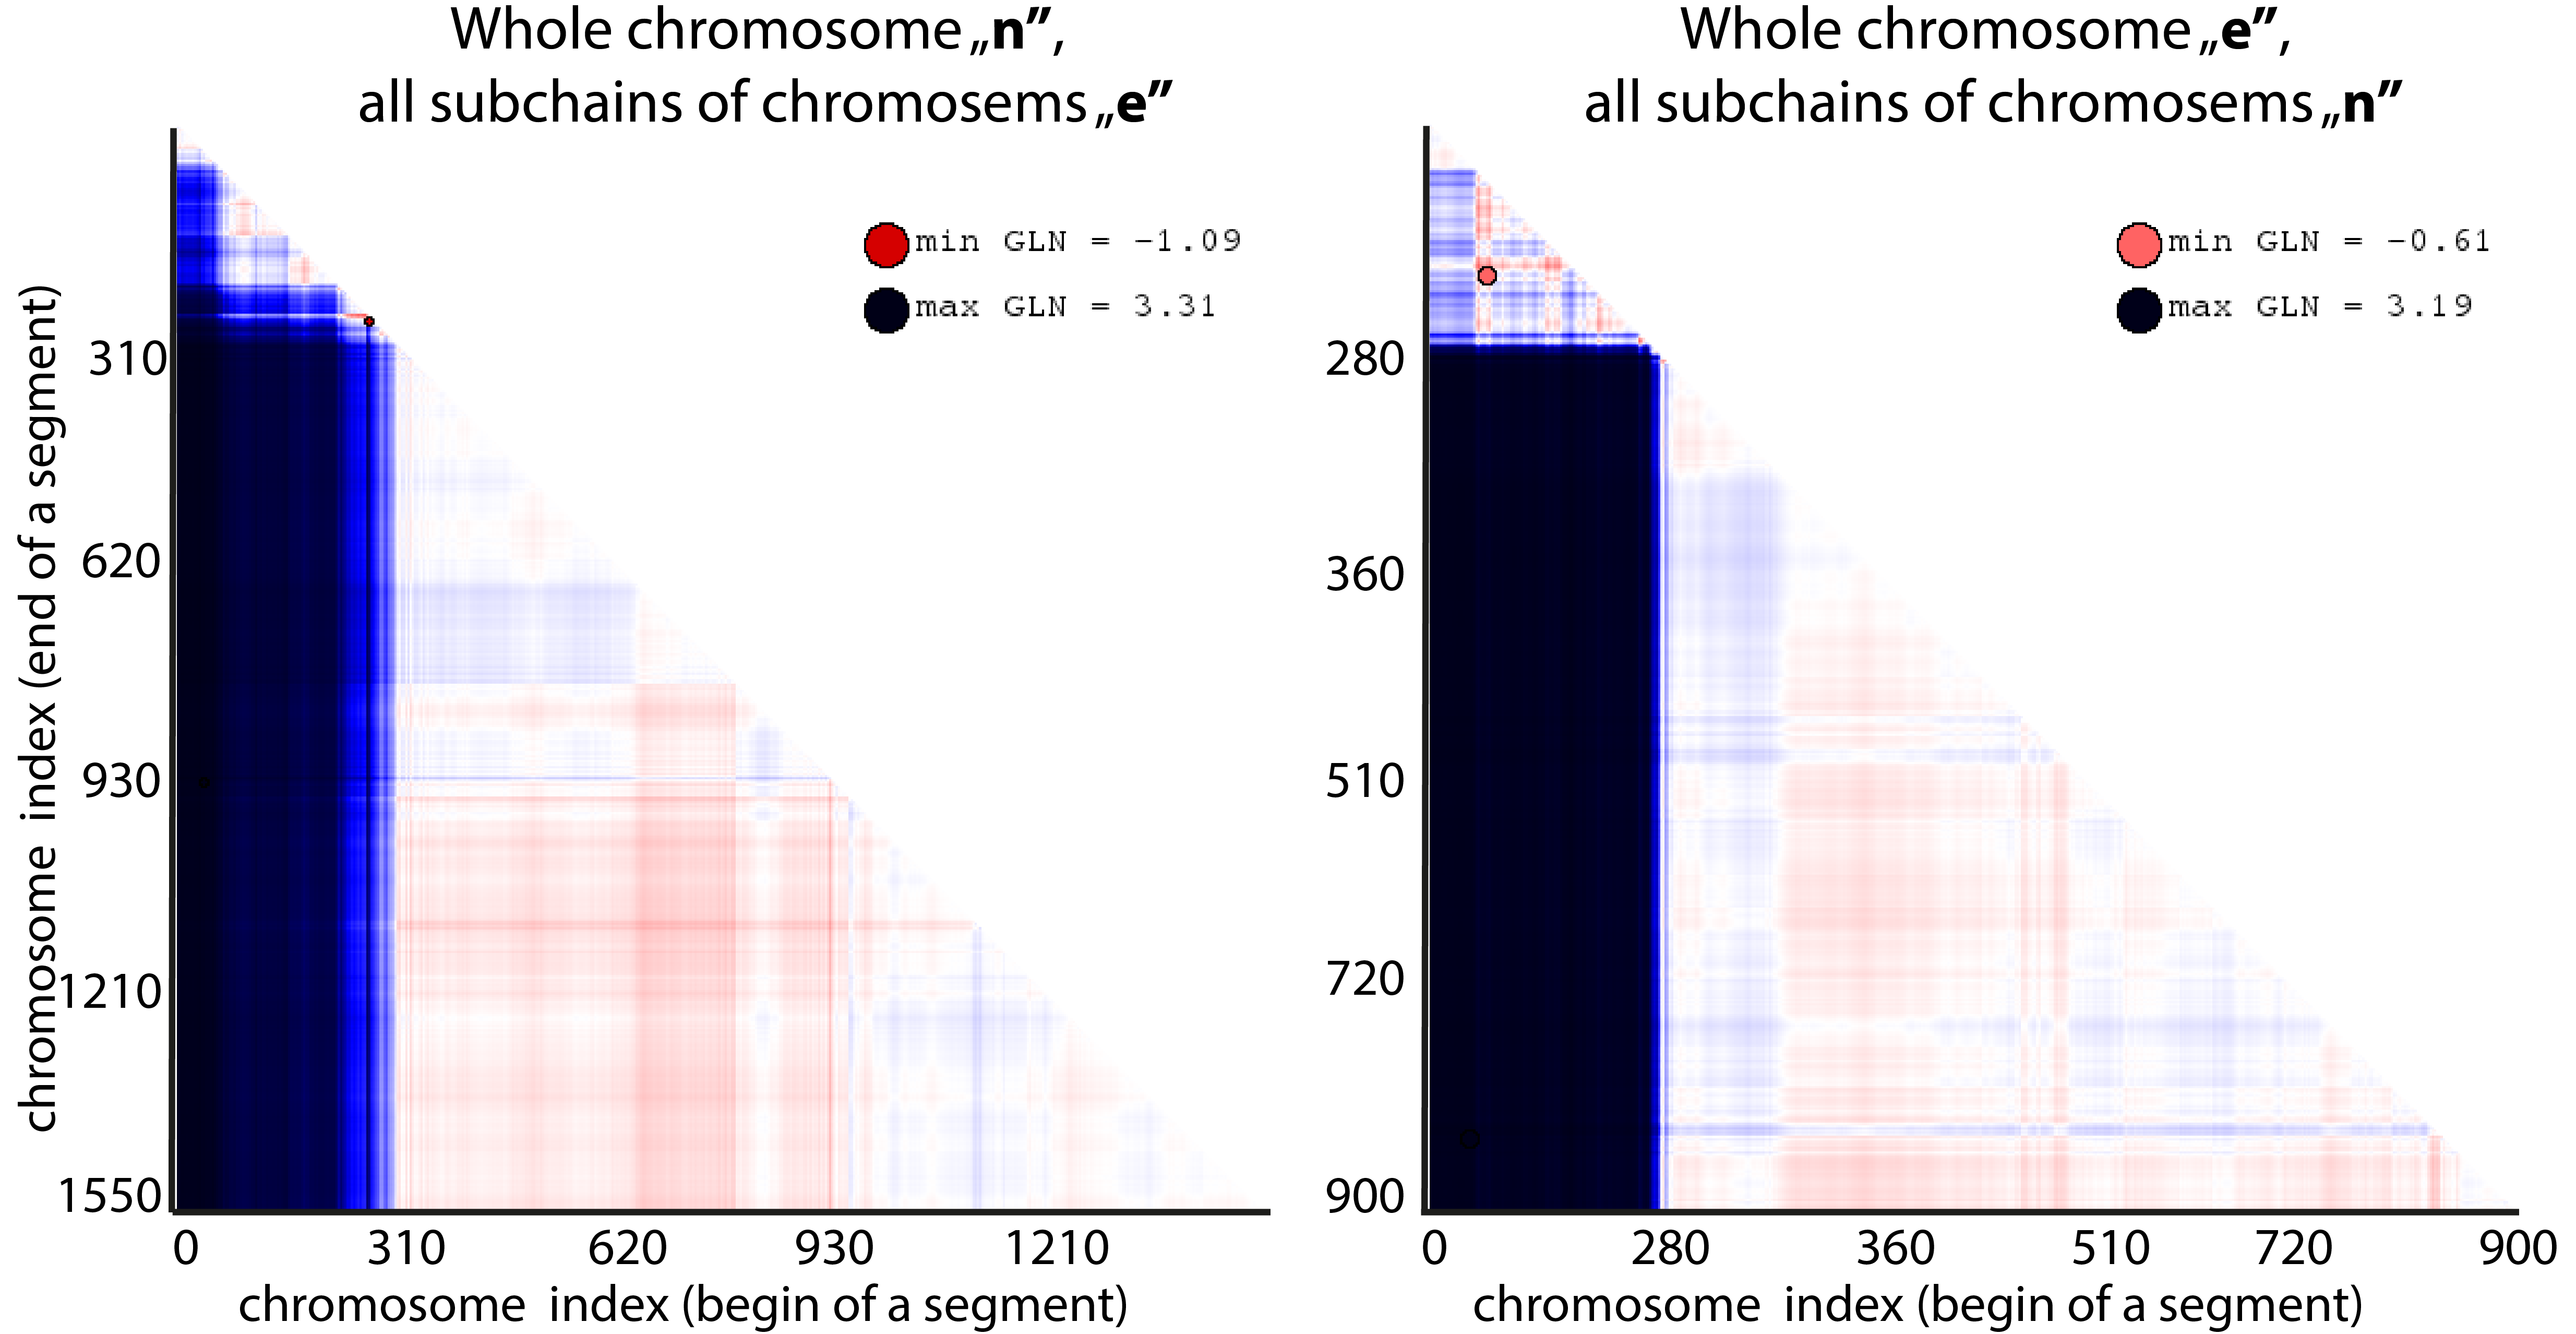
Fig. 4 The GLN matrices presenting min and max GLN between chromosomes n and e. Left panel: value between the whole chromosome n with all subchains from the chromosomes e. Right panel: opposite situation.