The likelihood of real entanglement in a given chromosome or pair of chromosomes and if present their type can be estimated by use of the two following methods:
The server can be used to perform a short equilibrium molecular dynamics simulation of the provided chromosome model (selected chain or the whole cell) using GROMACS program [1]. The equilibration is performed using the structure based model representation of the system, in which the provided structure minimizes the potential function. The potential function has a following form:
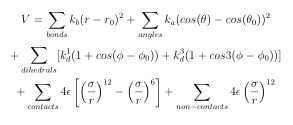
with the following force constants: kb = 20000.0 ε/nm2, kα =20.0 ε , k(1)d =1.0 ε , k(3)d=0.5 ε, α=0.2. The nonbonded interactions are introduced for each pair of beads, which is separated by a distance not larger than rcutoff=2.0 nm, and not shorter than rmin in the starting structure. Pairs of nonbonded beads which in the starting structure are within rmin distance do not interact with each other (remain transparent to each other). Otherwise the repulsive interaction is applied.
By default, the system is subjected to the 200000 time steps with the time step dt=0.0005 time units at temperature T=120. For these settings, fluctuations of the whole chromosome cell lead to RMSD of about 0.7-1.0 nm.
The implemented model takes into account the "imperfect" resolution (prediction) of some available data (some beads can almost overlap). In such case, each bead which is within a distance of rmin=0.6 nm of the preceding bead along the chain, is removed. For example for the structure of the intact genome of model 3 from cell No. 2 [2] this procedure leads to a reduction of 4% of beads, with no change of the topology.
Molecular dynamics simulation of a given chromosome or pair of chromosomes is performed in the vicinity of all uploaded data. In a molecular dynamics simulation all chromosomes in the provided system interact with each other through the network of native-like interactions defined in the starting structure. To observe relaxation of a given chromosome (or group of chromosomes) with no interactions with other chromosomes, the user can upload either a single chromosome or a pair of chromosomes.
In the most advanced case the user can upload 60 chromosomes corresponding to a full cell at once.
The maximal size (number of beads) for a single chromosome is 2000.
The parameters provided for the equilibration were tested based on the chromosome topology (stability) on the system investigated previously [3], which is the model 3 of the chromosome 14 from cell 2 [2] Fig. 1A. In this case KnotGenom detects two left handed trefoil knots when the whole chain is analysed. The positions of knots along the chromosome are shown in red and blue in Fig. 1B. The chromosome was simulated alongside all other chromosomes from cell 2 (model 3). Fig. 1A shows typical conformations of the chromosome observed in molecular dynamics simulation.
Table 1 presents results of topological analysis for each ten conformations of the chromosome observed in a single trajectory of molecular dynamics simulation. This data shows that the example knot remains conserved during the whole simulation — the blue knot, Fig. 1. This result is in agreement with [3], where it was shown that in the very well-defined structure models after relaxation the knot remained in the structure. Such knots are called stable.
On the other hand, for the chromosome fragment with models differing strongly, the topology changes between the 31 knot and unknot even for very short relaxation times. This result is also in agreement with previous analysis [3]. Below, the snapshots of this chromosome fragment (the first is the starting configuration, the second results in 31 knot, and the third provides an unknot) are presented.
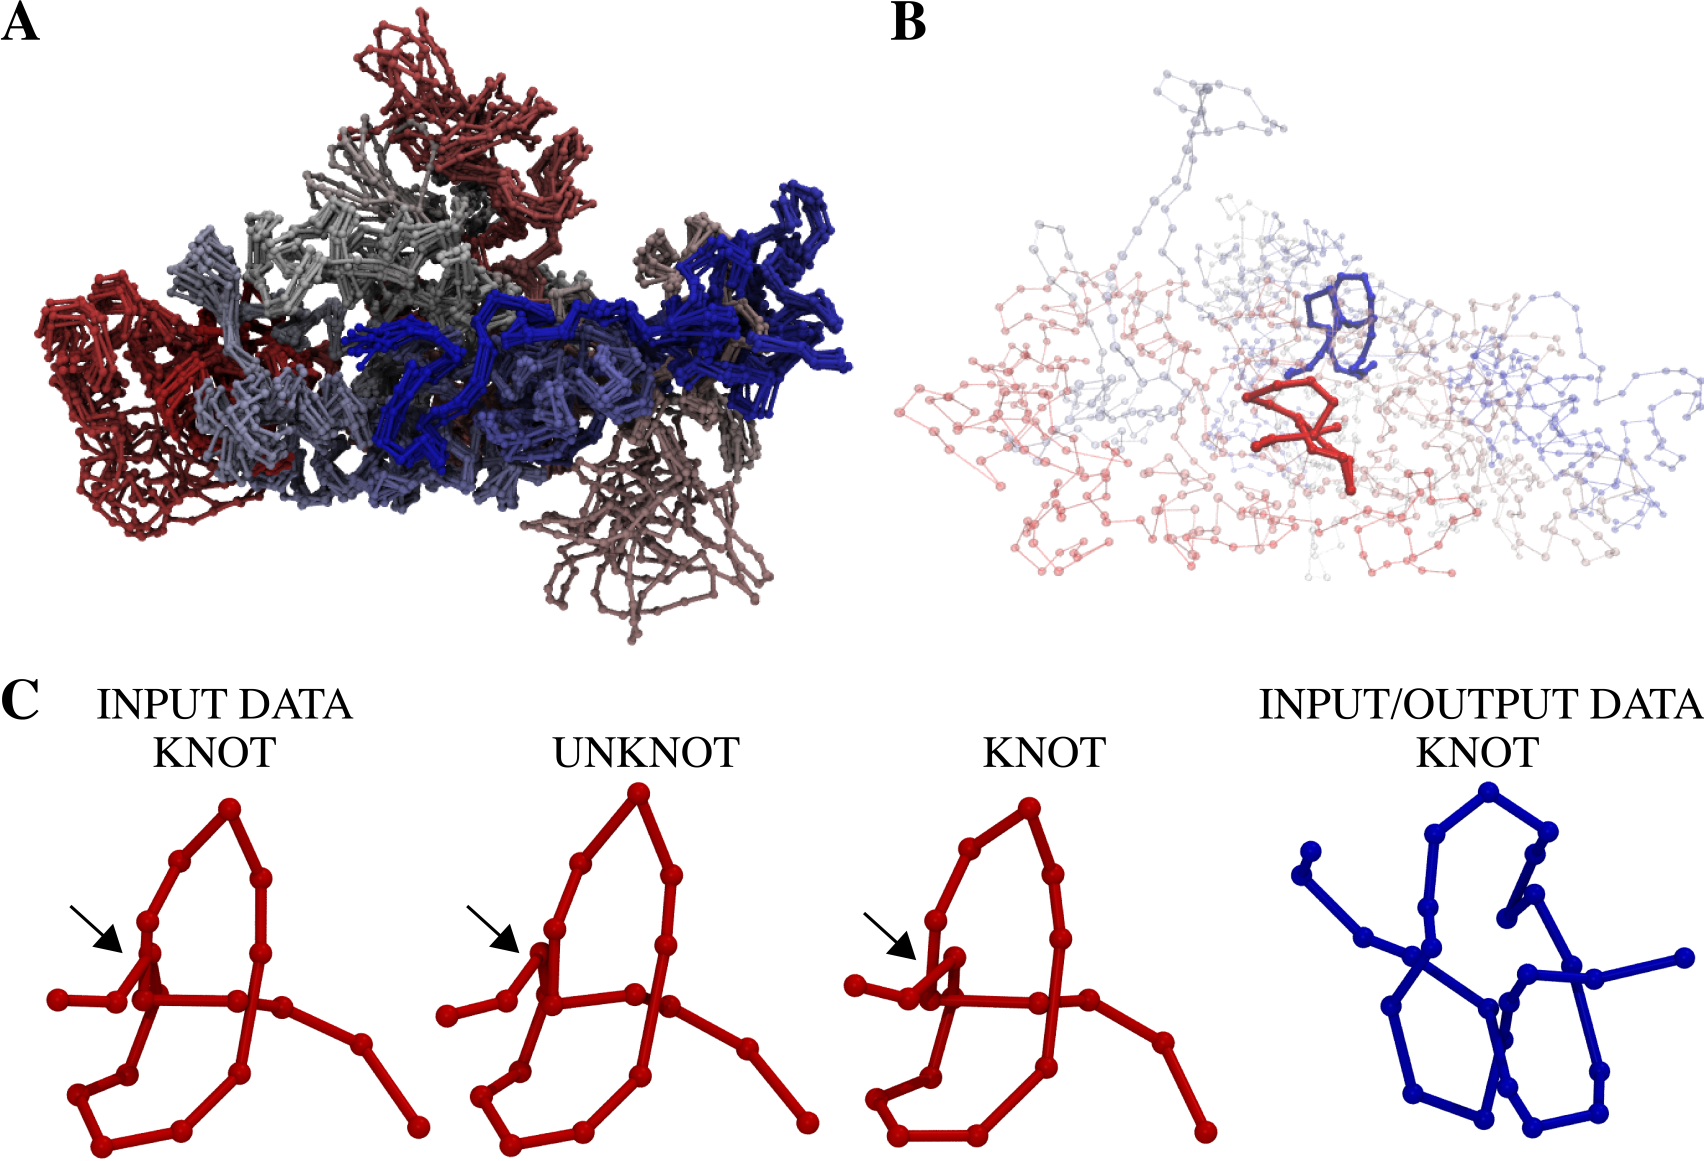
Fig. 1 Structure of chromosome 14 from cell [2] and its conformations observed in the molecular dynamics simulation. Panel A shows every tenth configuration during molecular dynamics simulation in the presence of all other chromosomes from the cell 2. Panel B shows the chromosome configuration before equilibration with two trefoils denoted with blue and red. Panel C shows snapshots of the red chromosome fragment (the first is the starting structure, the second results in 31 knot, and the third provides an unknot). The blue chromosome fragment is shown as well. During equilibration the red knot can easily untie or retie. The blue knot remains present during all simulation time.
A Molecular dynamics simulation (relaxation) of a given pair of chromosomes is performed alongside with other uploaded chromosome structures. To observe conformational changes in pairs of chromosomes without including interactions with neighbouring chromosomes, the user can upload a file containing only the structure of a given pair.
Below an example of a stable and an unstable link (artificially linked chromosomes) is shown which have been detected by molecular dynamics simulation of the whole cell:
In the case of chromosomes d and h, KnotGenom detects a complex structure which is called "Other" independently of the method used to close each of these chains. "Other" is observed in 100% cases using the probabilistic method. Please, note that very often, the detected polynomials for chromosomes indicate more than 10 crossings, which herein are called "Other". "Other" has two meanings: (i) chromosomes are not linked but they are knotted or (ii) chromosomes are linked (for more details see section
The results of entanglement analysis performed on chromosomes based on conformational changes observed in molecular dynamics simulation are presented in Table 1. These results show that the entanglements and their types remain the same (even irrespectively of the closing method) during the entire relaxation process. The same properties are observed based on almost constant value of whGLN and maxGLN. This strongly suggests that these two chromosomes are linked. The linked region between chromosomes is visual in red and blue in Fig. 2C and D.
Remark: The same conclusion can be achieved when topological analysis is performed on all 10 models [2], however, this approach is more time consuming. The method implemented in the KnotGenom to study stability of entanglement detects topology only for a few conformations and thus is much faster. The rules to evaluate changes in entanglement are described here.
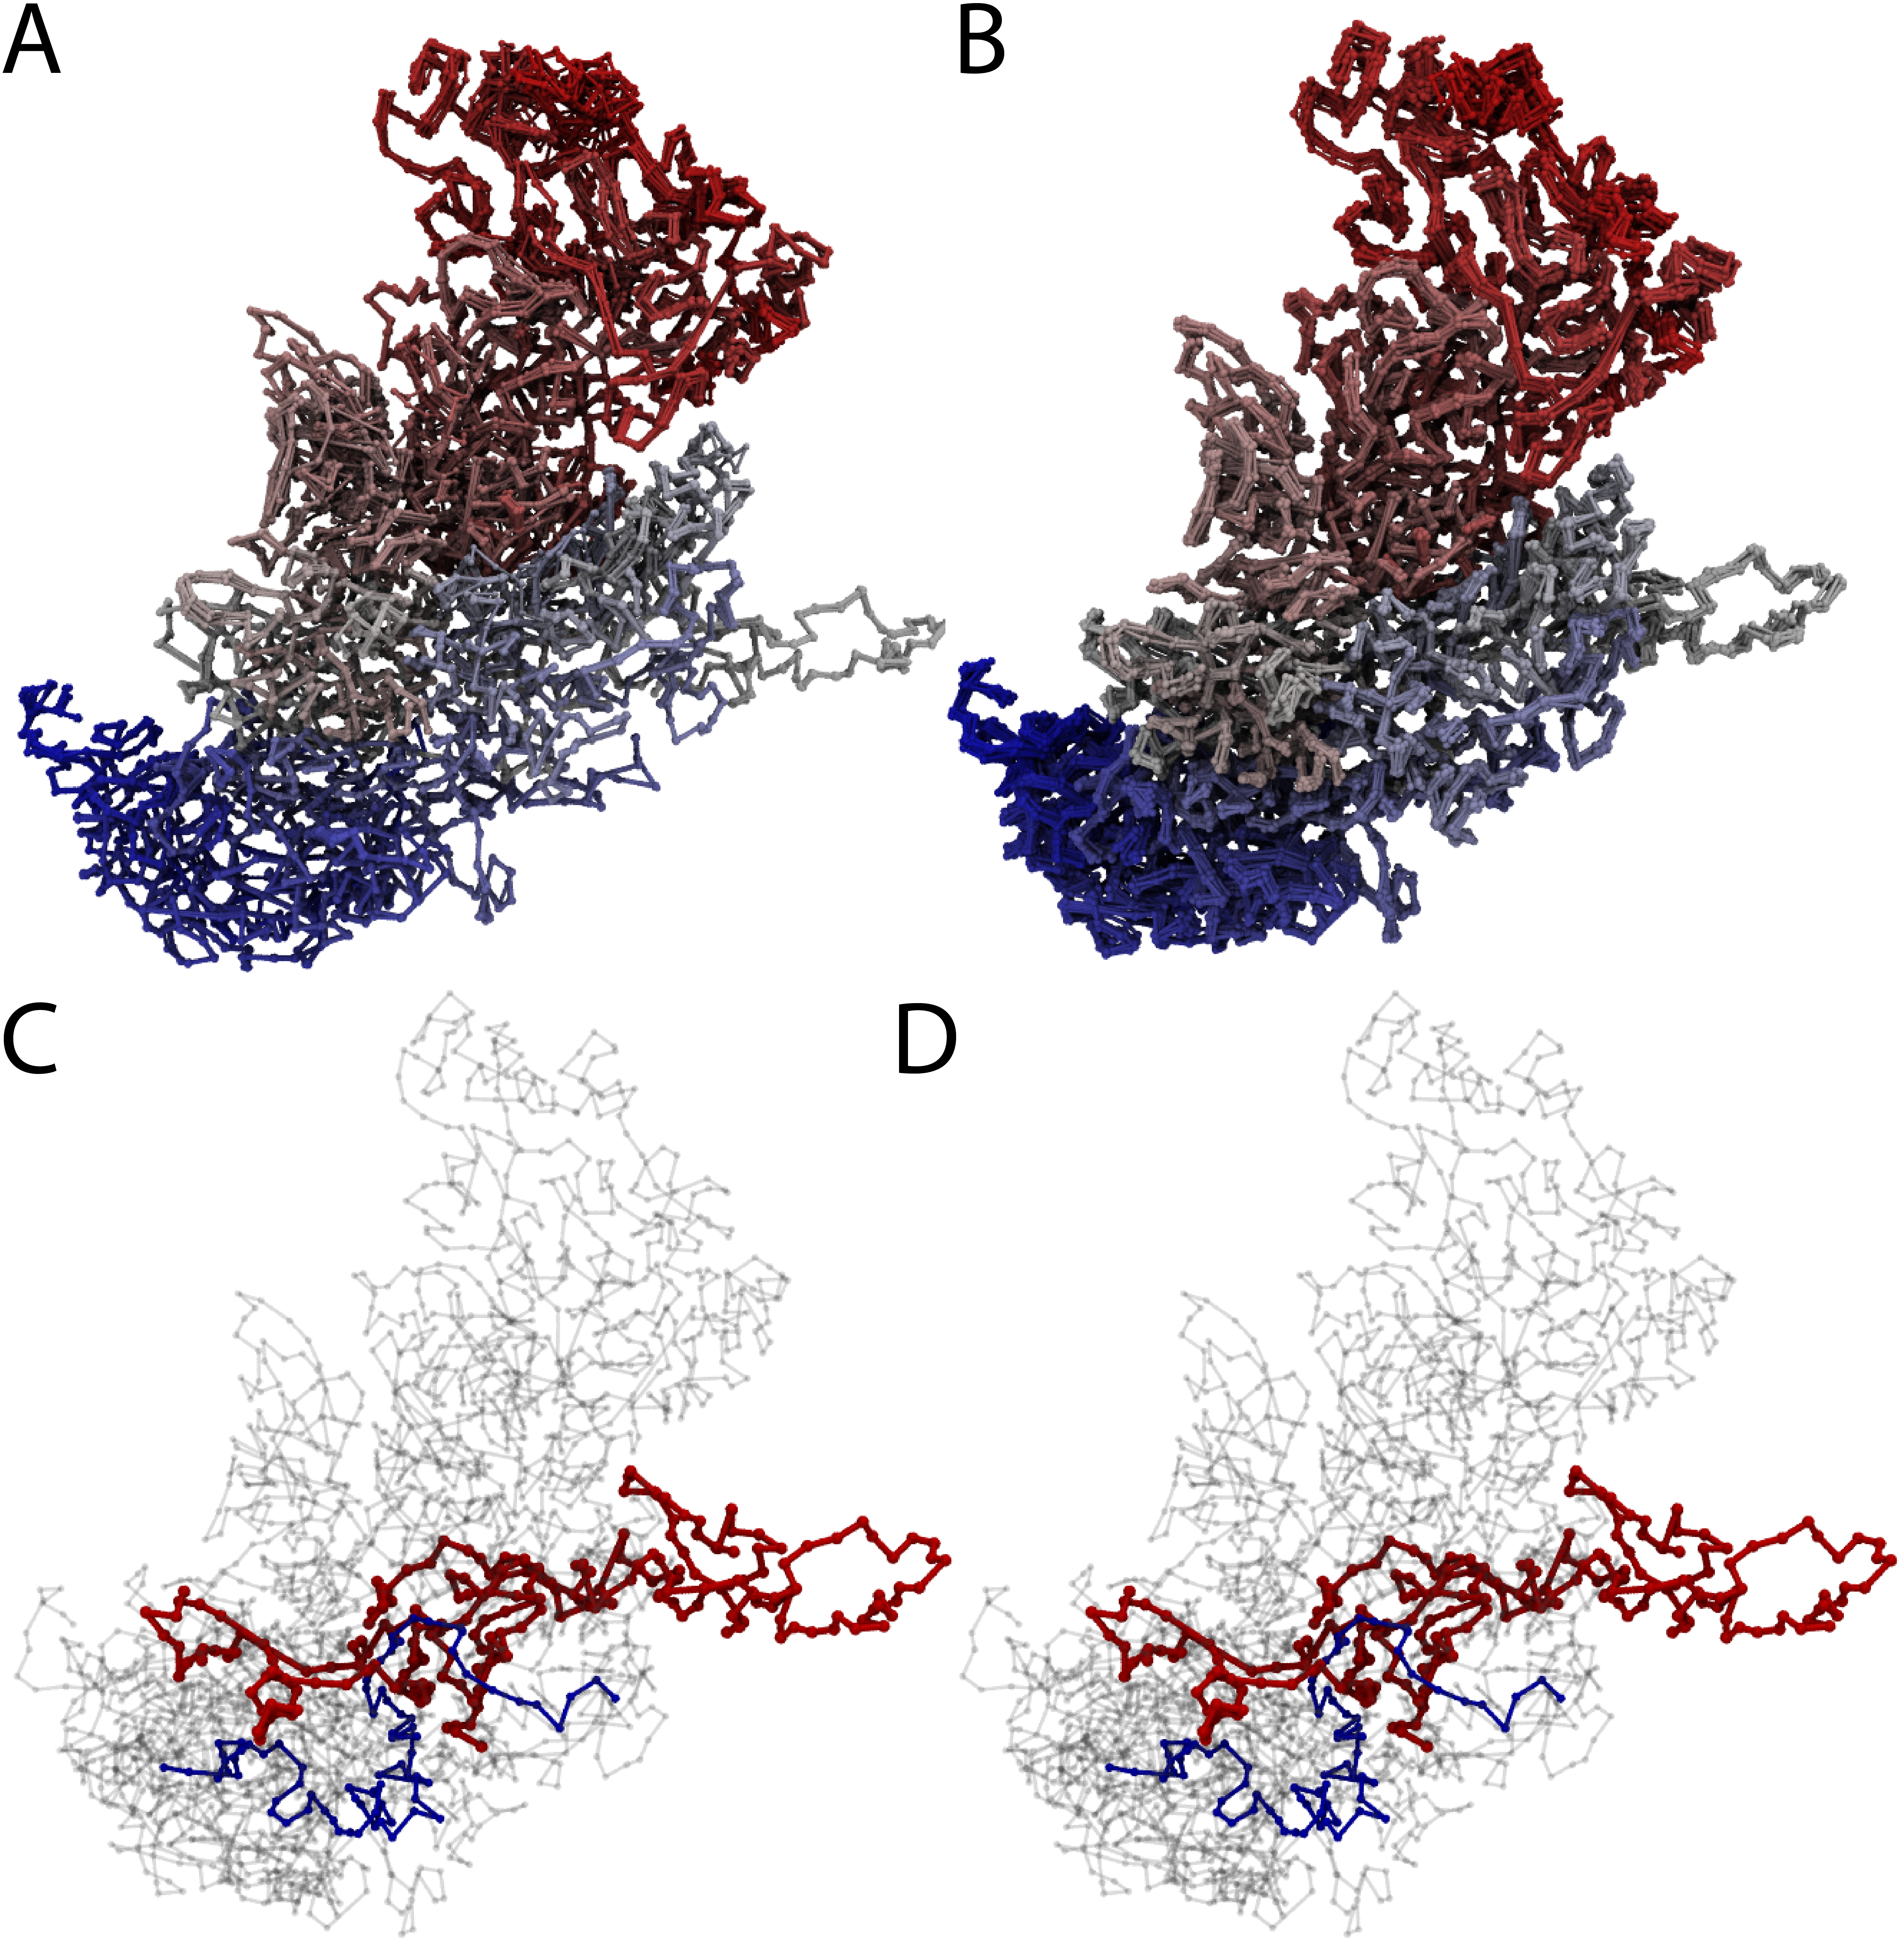
Fig. 2 Structure of chromosomes d and h from cell 1 [2]. Panel A shows a comparison of all 10 models of chromosomes d and h. Panel B shows a comparison of 10 configurations of chromosomes d and h observed during molecular dynamics simulation. Panels C and D show example configurations from panel B with colored position of the detected link between chromosomes d and h. The red and blue part of the chromosomes, as shown in panel B, has a very well-defined structure in all the models as well as during molecular dynamics simulations.
Table 2. Entanglements observed in chromosomes d and h from cell 1 [2] during molecular dynamics simulation. Every four rows present: time step; type of closure method, and type entanglement with its probability (All=20 denotes probabilistic method with 20 closures, All=1 denotes one closure, the centre of mass method); the last row shows entanglement measure via Gauss Linking Integra, whGLN and maxGLN. This data suggests that chromosomes d and h are stably linked.
Table 3. Example of the performed analysis of entanglement for pairs of chromosomes (d and r, cell 1 [2]) based on 10 configurations from molecular dynamics simulation. Every four rows present: time step; type of closure method, and type entanglement with its probability (All=20 denotes probabilistic method with 20 closures, All=1 denotes one closure, the centre of mass method); the last row shows entanglement measure via Gauss Linking Integral, whGLN and maxGLN. This data suggests that chromosomes d and r are unlinked, and each of these chromosomes possesses unstable knots.
In the case of chromosome r and d the topological analysis based on model 1 [2] indicates:
Probabilistic closure: COMPLEX(40%): +3_1 U +3_1(60%), Other(40%)
Determinist closure: COMPLEX(100%): +3_1 # +3_1 # Hopf.2(100%)
whGLN: -0.009, max|GLN|: -0.038.
This data suggests that chromosomes d and r are unlinked — both whGLN and max|GLN| are close to zero; however, at least one of these chromosomes should possess a non-trivial topology. The absence of linking of the chromosome chains is clearly visual in the Fig. 3.
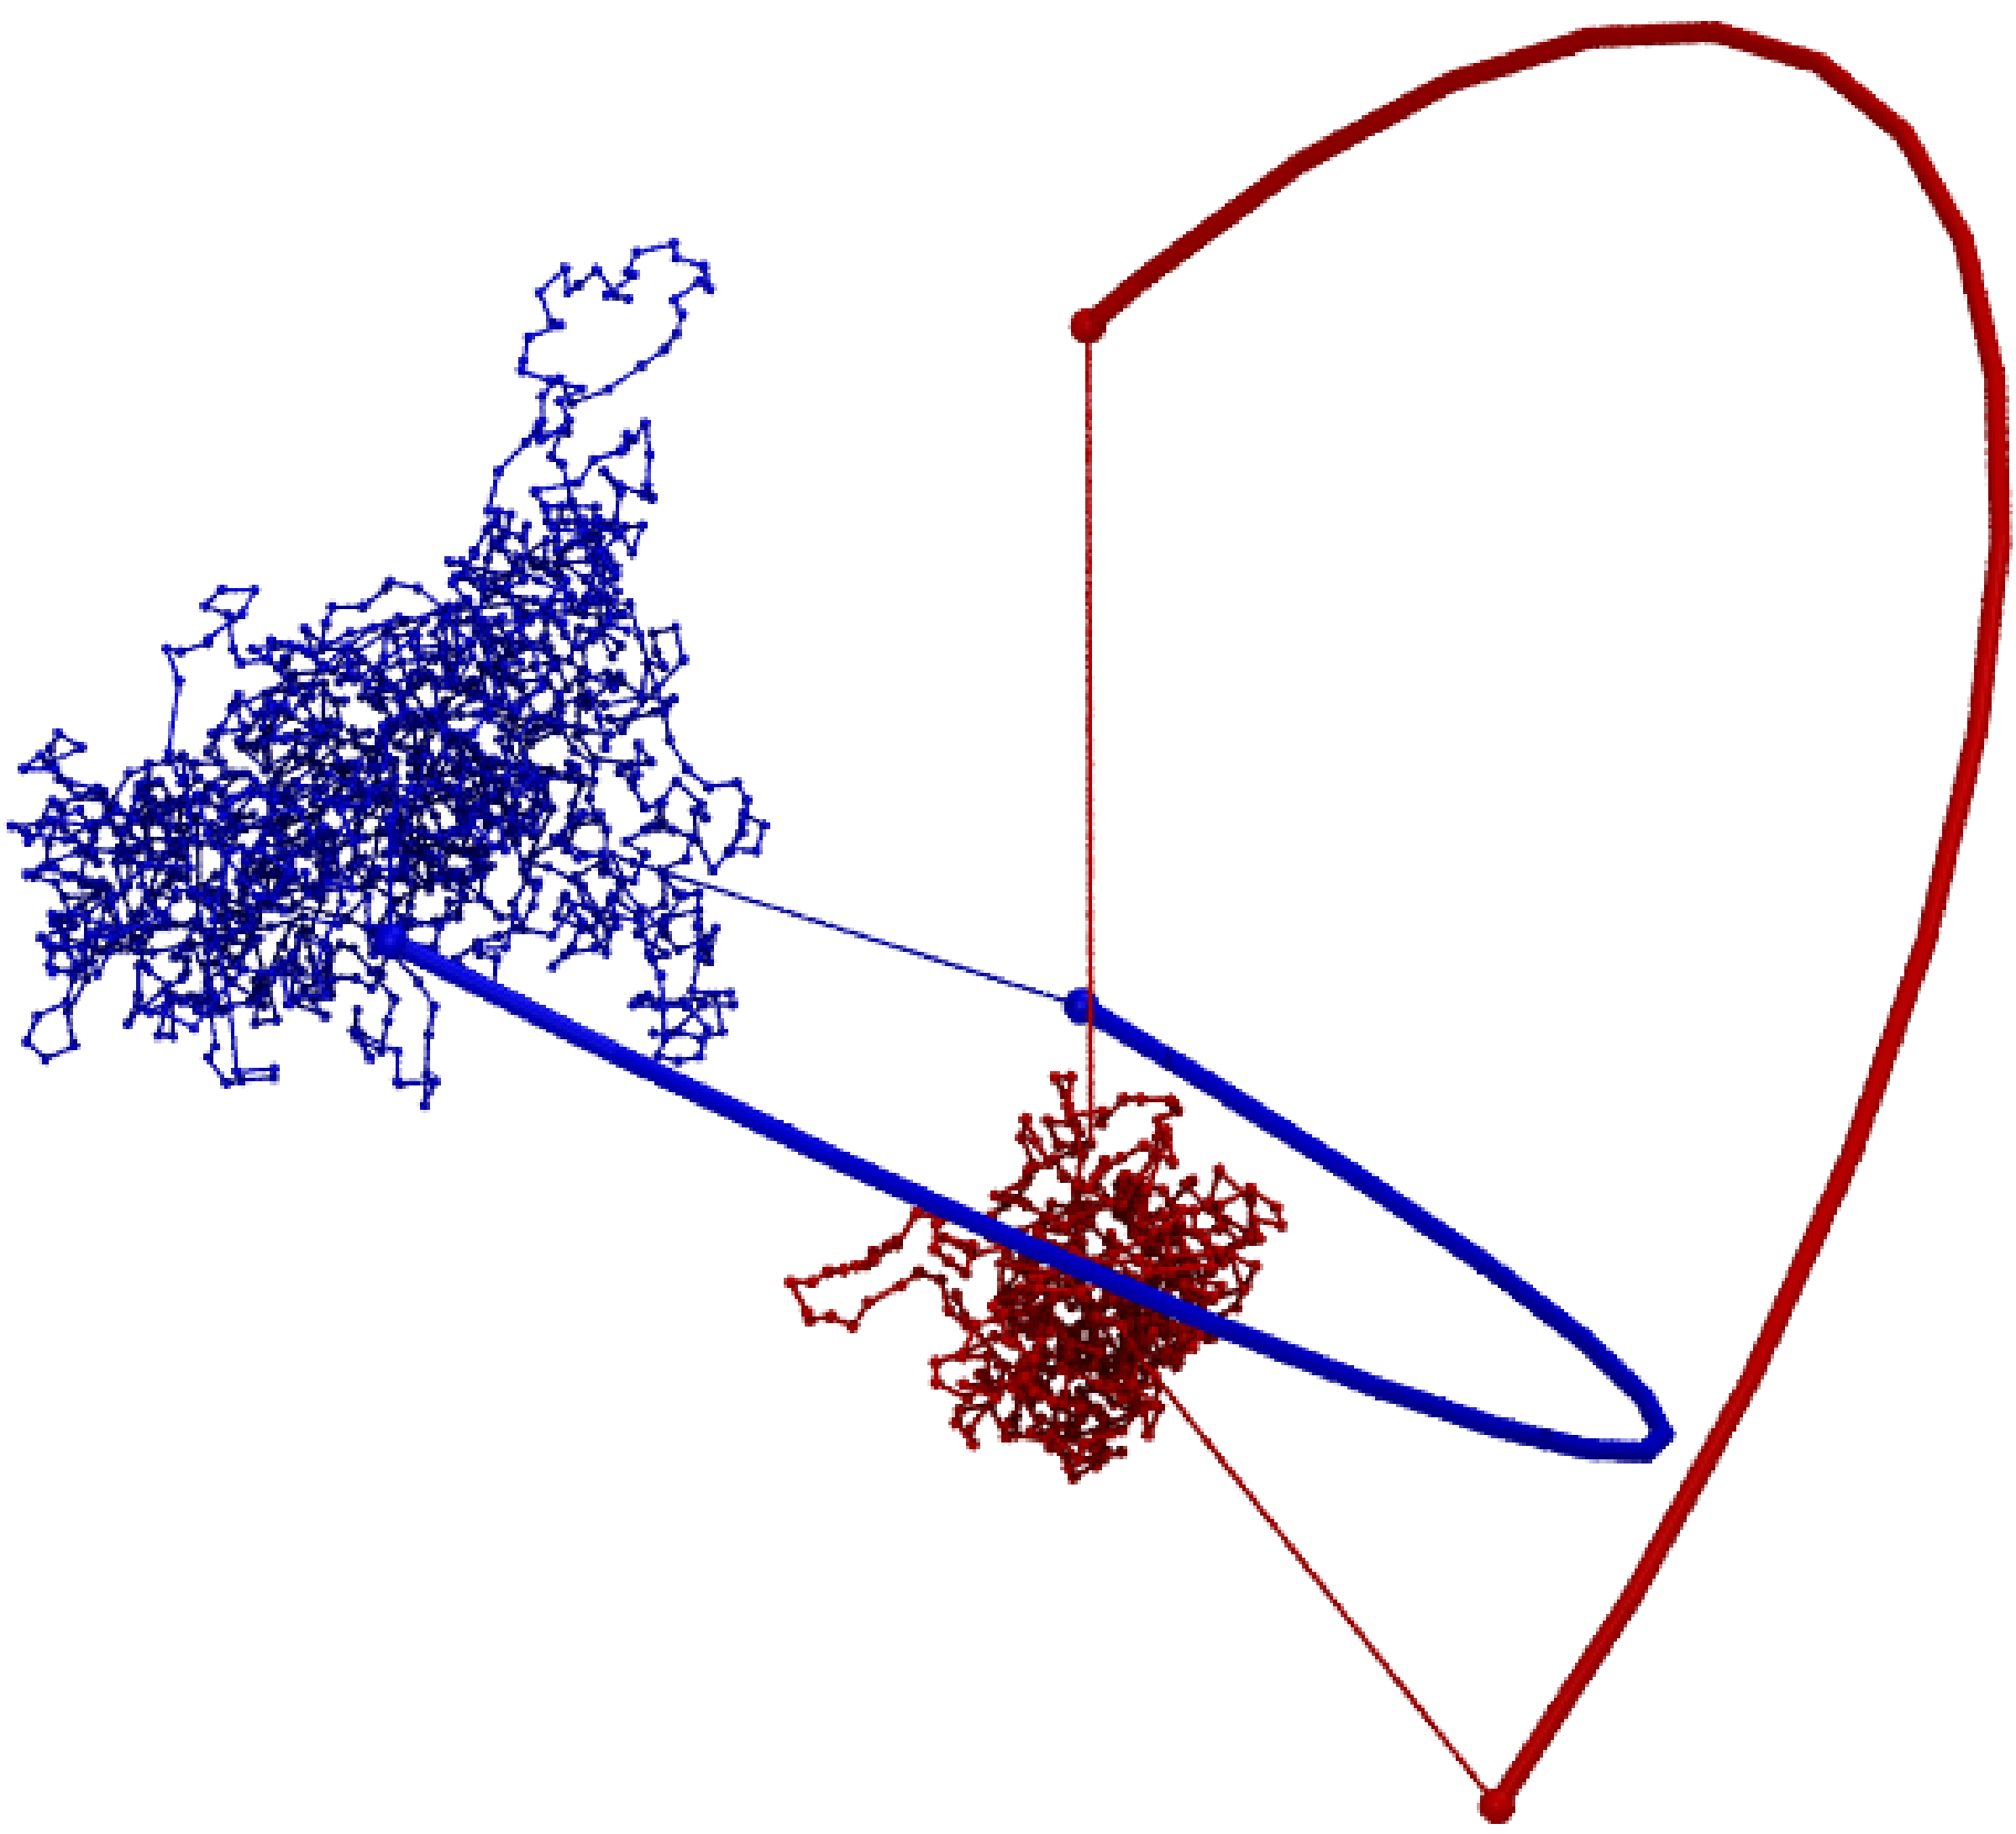
Fig. 3 Structure of chromosome d and r from cell 1 [2] with a probabilistic link. Such a link as expected has whGLN and maxGLN close to zero correctly indicating that these chromosomes are not linked directly to each other.
Results of entanglement analysis performed on structures of pair of chromosomes observed with molecular dynamics simulation are presented in Table 3. These show that the entanglements and their type change rapidly during the entire relaxation process. However, the value of whGLN and maxGLN remains constant and close to zero. This strongly suggests that these two chromosomes are not linked and the entanglement of each of them is also unstable.
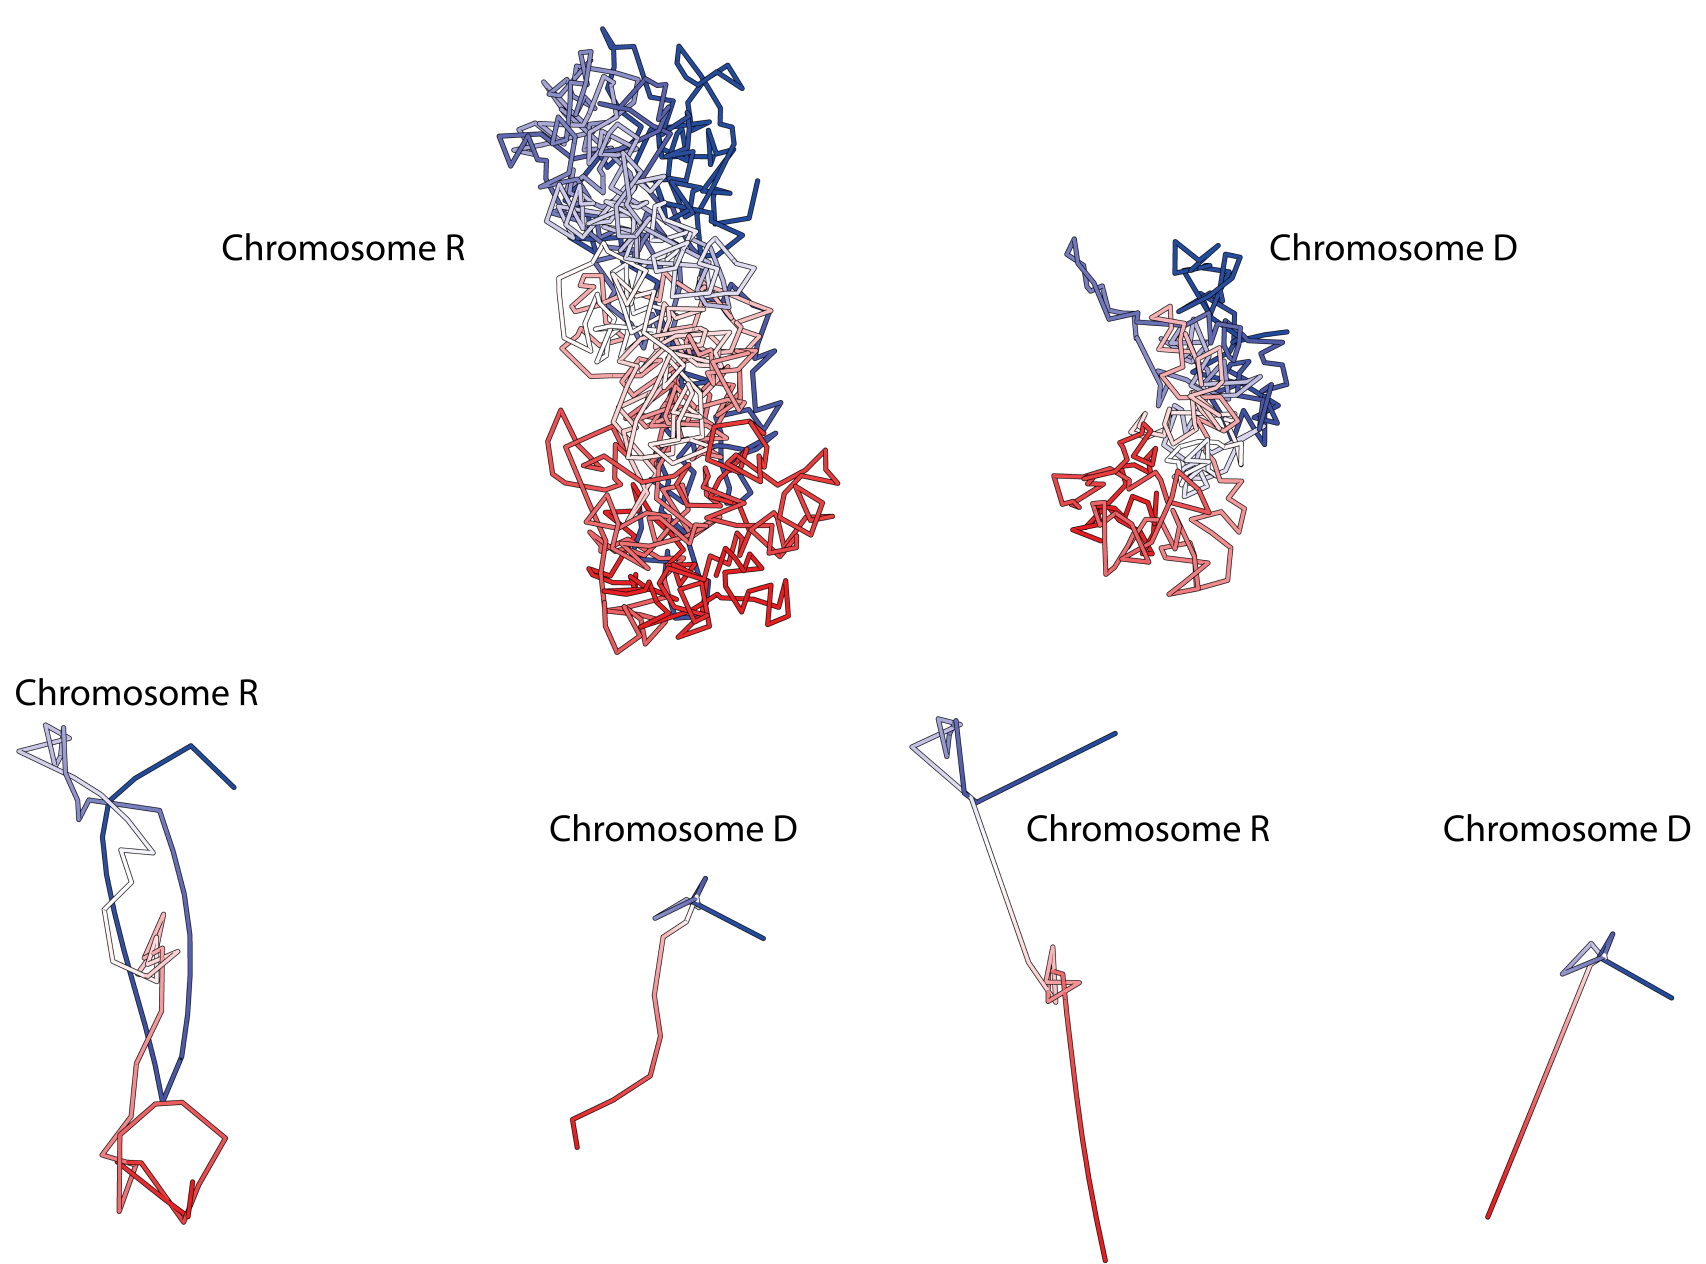
Fig. 4 Top: Structure of chromosomes d and r from cell 1 [2]. Bottom: Simplified structure of these chromosomes.
Based on the analysis presented above (for a single chromosome and pairs of chromosomes), we implemented the following rules:
Let's assume that a given knot or link has a type A with probability p (p is equal 100 if the deterministic method is used; when probabilistic links are detected, p corresponds to the most probable link type, called the leader). For each 10 representative configurations, the type of entanglement, denoted by A1, A2, ..., A10, is assigned to the first, second, ... and the tenth frame, with given probability p1, p2, .... p10, respectively. The type of entanglement and its probability before relaxation are denoted by A and p0, respectively. A1=A2 means that the type of entanglement is the same and |p1-p2|<=20. In the link matrix elements are colored based on the following rules:
In the case of GLN matrices (whGLN and max|GLN|), let’s assume that a given whGLN has value g. For each 10 representative configurations, the value of whGLN, denoted by g1, g2, ..., g10, is assigned respectively to the first, second, ... and the last frame. The magnitude of entanglement before relaxation is denoted by g. The case when g1!=g2 means that the type of entanglement has change when |g1-g2|>0.1. In the link matrix elements are coloured based on the following rules: