The user can upload and analyze more than one pair of chromosomes, this means that even an entanglement of the whole cell can be determined. in such case, the entanglement is presented via interactive matrices which dimension corresponds to a number of single chromosomes pairs. Thus all topological methods, their results, and techniques of presentation used for a single pair of chromosome are also available for multi-pairs systems. The overview of typical output for 20 chromosomes is presented in Fig. 1. To avoid repeating of the detailed description, herein we only summarize presentation of the results and point out differences. The user is referred via links to single pair chromosome analysis.
Entanglement of pairs of chromosomes is presented in the following manner. The information displayed from top to bottom of the result page can be divided into:
Each of these parts is described in detail below. Additional examples are shown here - examples.
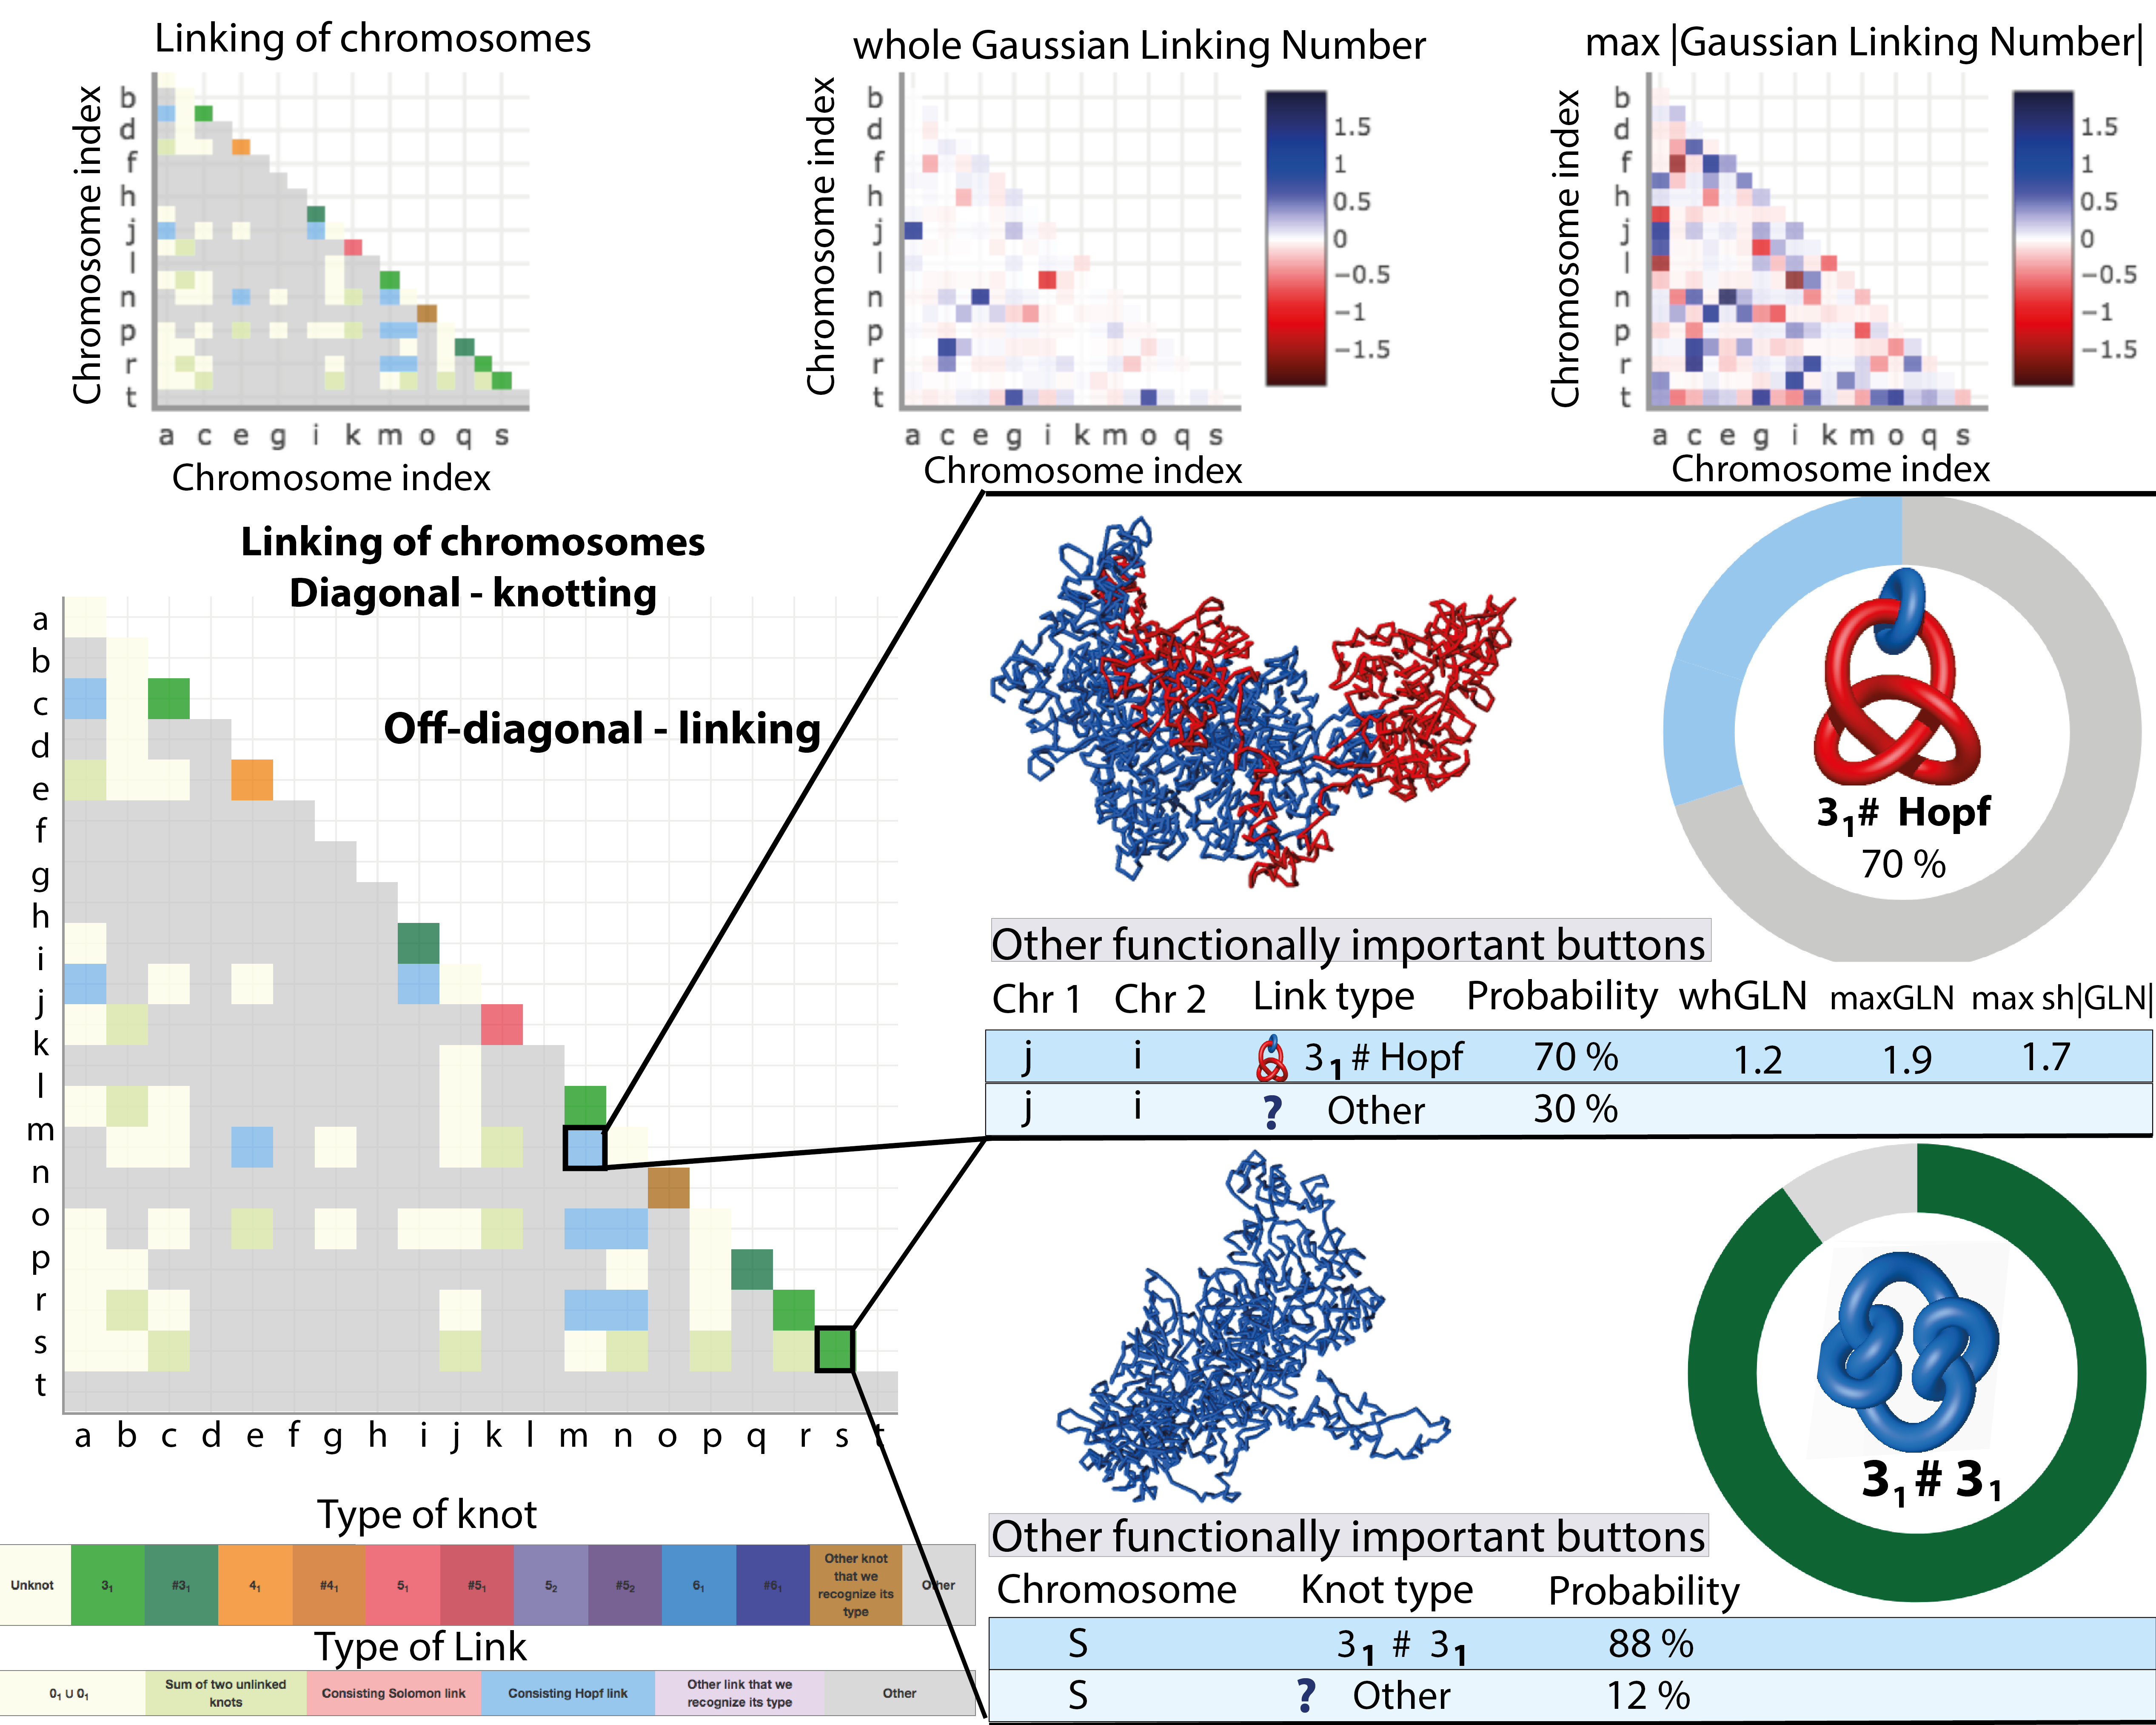
Fig. 1 Overview of a comprehensive topological analysis of a whole cell, e.g. 20 pairs of chromosomes. Top row the miniature figures of interactive matrices: Linking chromosomes (showing with color code identified knots, links), whole GLN and max |GLN| which shows entanglement computed based on Gaussian linking integral, which is another measure of entanglement between a pair of chromosomes. Upon pointing the cursor on the element of matrix detail information about topology is provided. Upon clicking on the element of matrix a new subpage will be provided containing the Graphical representation of the chromosomes and knots or links likelihood, and the more extended version of the knot or link table is displayed. All matrices can be e.g. zoom in/out, modified and save using open source tool Plotly which allows interactive data visualization (https://plot.ly/).
At the top of the page, the first tab indicates the status of a submitted job. The tab summarizes options used by the user to submit a job and current job performance. This information is described here
Comprehensive information about an entanglement of a pair of chromosomes is presented using three interactive matrices as shown in Fig. 2.
When more than five pairs of chromosomes are analyzed, the matrices are shown via miniaturesfigures which, upon clicking, are presented on a full interactive screen. Pointing the cursor on a given element of the matrix will show the basic information about the identified topology. Clicking on such element will result in a new website with the comprehensive information about topology, including: a table summarizing detected types of knots or links, a graphical representation of the chromosomes and the knot(link) likelihood.
The topological and structural details about the most probable knot (when the probabilistic closure method is used) are stored in the Knot table (Fig. 2). The content and visualization are the same as in the case of single chromosome pair – each row of the table describes knotting on a single chromosome chain . By default, the chromosomes with a trivial topology are not listed in the table. Upon clicking the button "Toggle hidden" all chromosomes will be listed in the table.
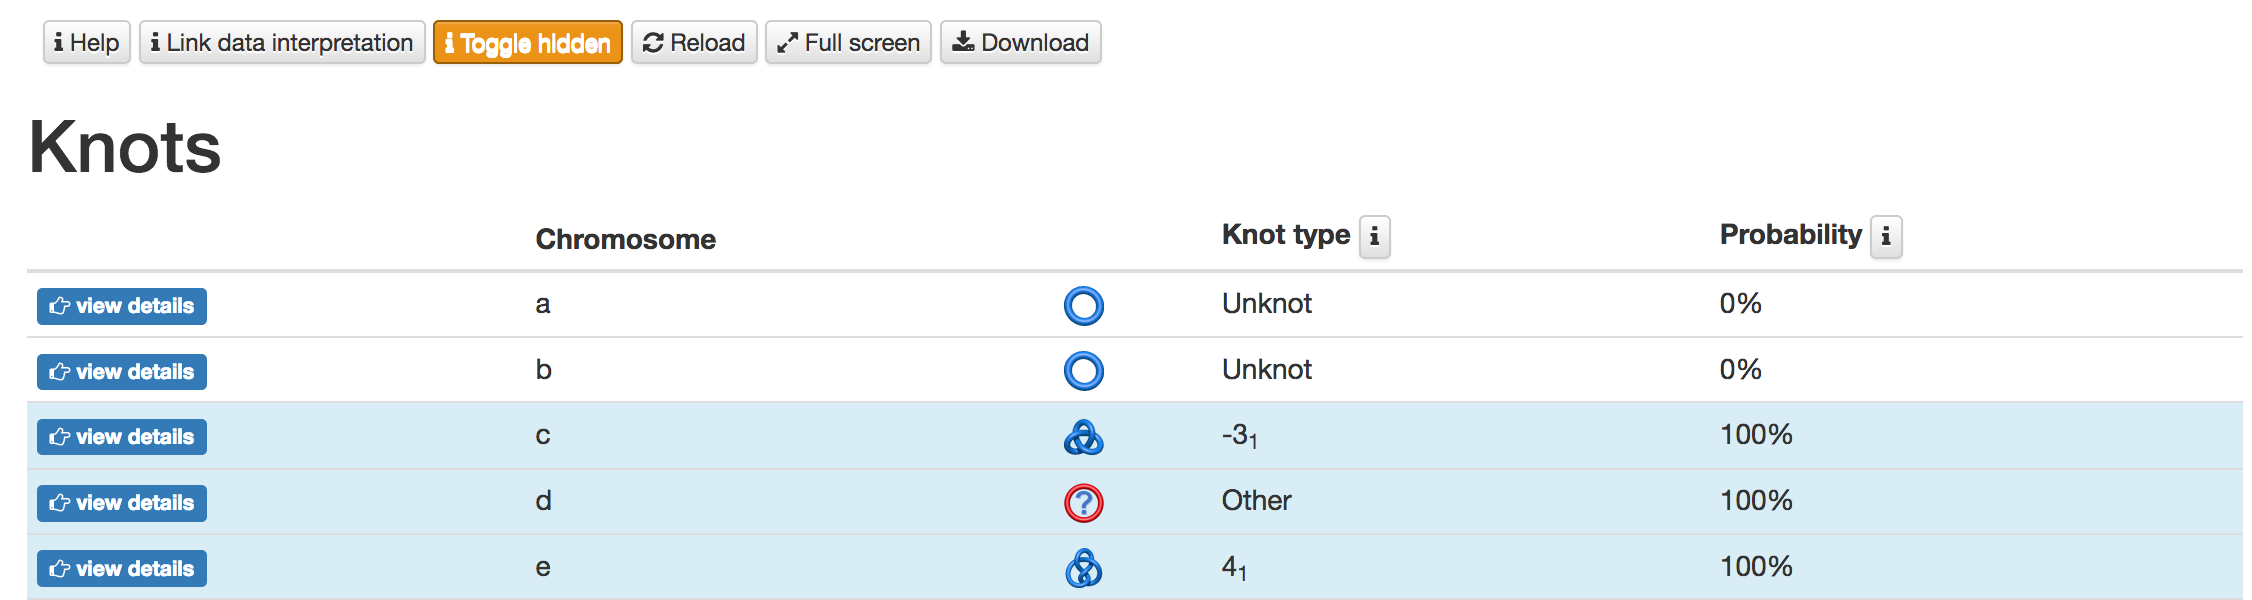
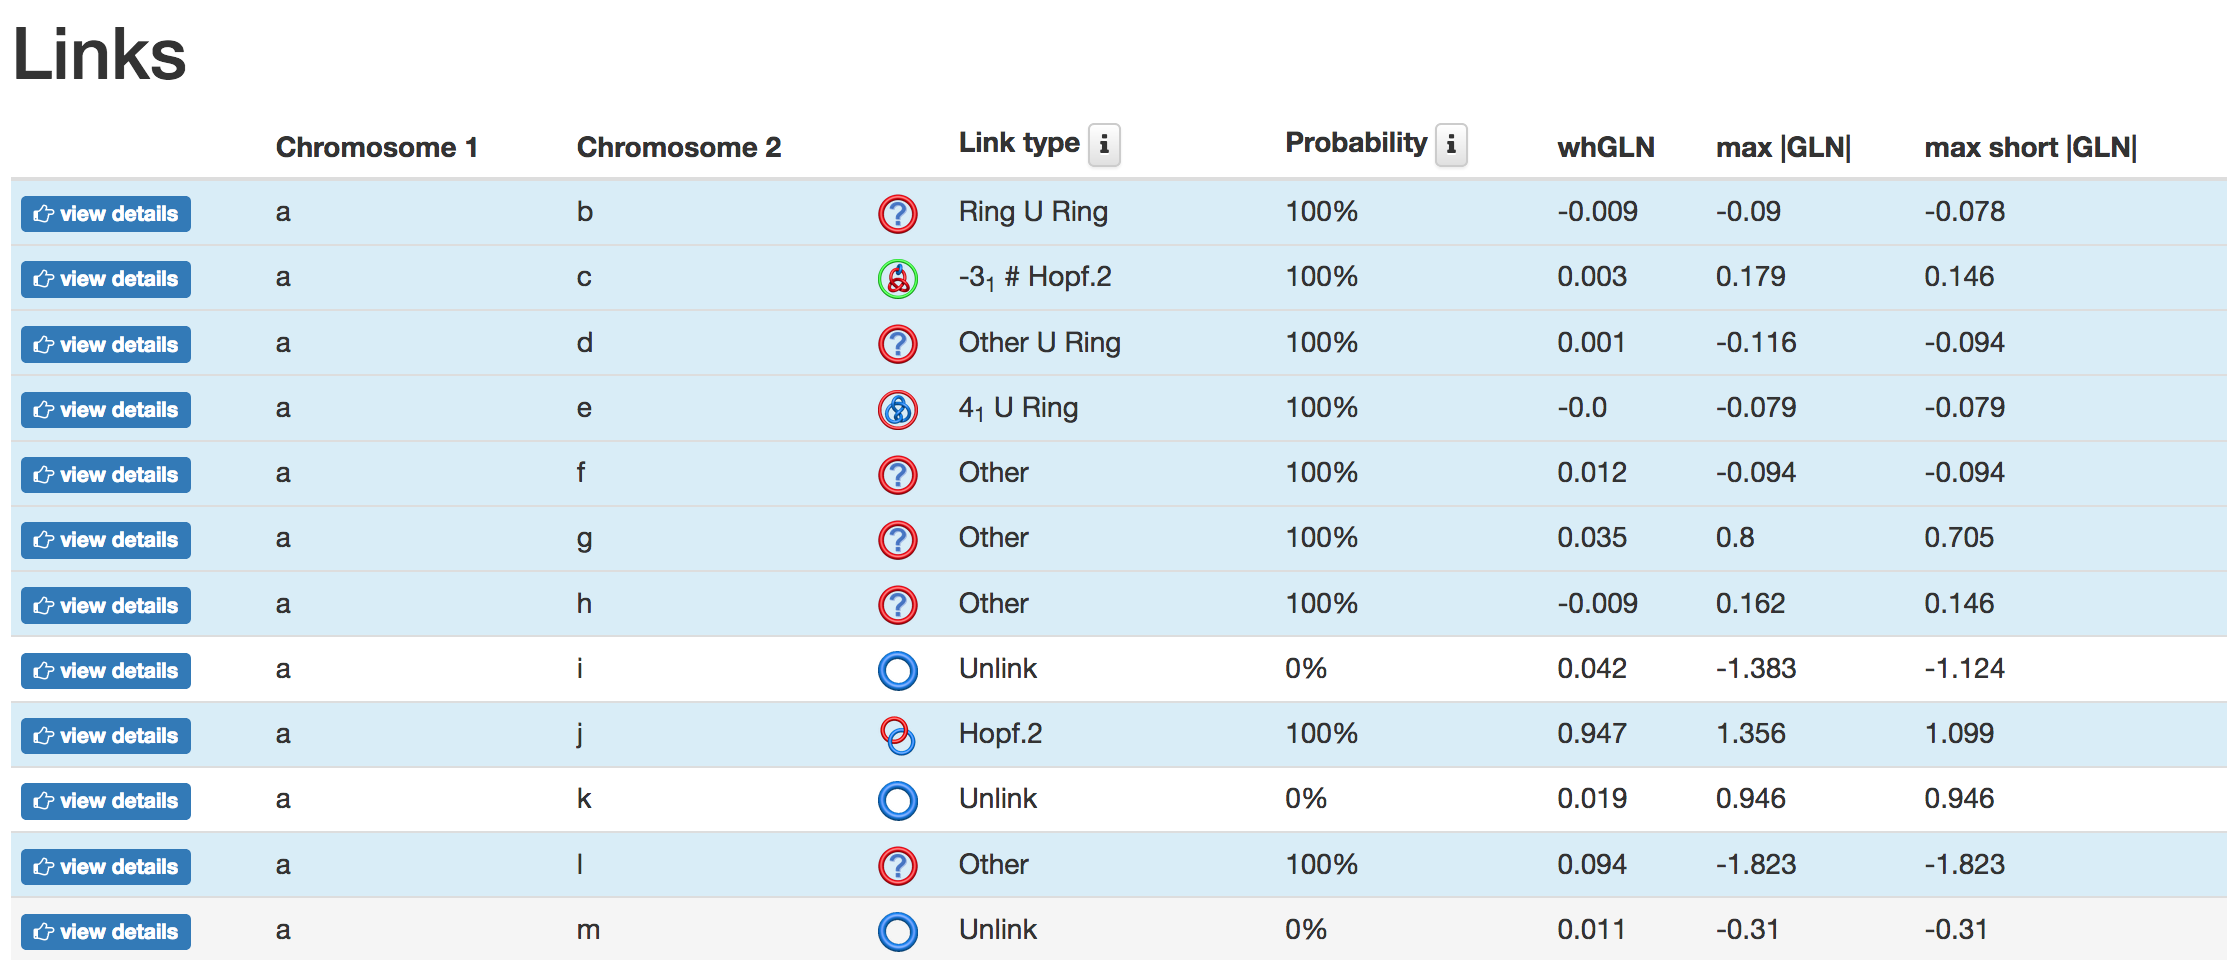
Fig. 2 Examples of data presentation in the form of tables for the identified knots and links in analyzed 20 pairs of chromosomes – only a part of such tables are presented. Tables contain the types entanglement, a schematic drawing of topology, probability and entanglement measured with Gaussian Linking Number – whGLN, max|GLN|, max short |GLN|. Upon clicking on "view details" a new subpage including the Graphical representation of the chromosomes and the knot or link likelihood, and the more extended version of the knot or link table will appear. Presented data were analyzed with the centre of mass method. Above the tables, there are placed additional buttons to facilitate further analysis
The topological and structural details about the most probable type of link are stored in the LINKS table (Fig. 2), below the KNOT table. Each row of the table describes the type of the entanglement (the link type, whGLN, maxGLN, shortGLN) between a single pair of chromosomes. The content of the table is described here XXX. This table can be very long – e.g. when 20 chromosomes are analyzed in principle 190 rows can be listed. To minimize the size of the table by default only pairs of chromosomes with a non-trivial topology are listed.
Details about identified links are presented on a subpage which contains the JSmol presentation of the chromosomes structures (left) and the pie chart (right) representing the likelihood of each of the identified links. By default, the most probable link type is shown in the center of the pie chart. This presentation is the same as for a single pair of the chromosome and can be found here.
When the relaxation method is used to study the robustness of the entanglement, the Hamiltonian (relaxation procedure) includes interactions between all chromosomes. This means that each chromosome is simulated in the presence of all the others (via native interactions and excluded volume effects) and tha each chromosome can penetrate his neighbors. In the consequence, during equilibration, the topology of a single chromosome can change e.g. untied, tied or change knot type as well as the entanglement between any pair, e.g. they can unlink, link or change linking type. In principle, newly linked chromosomes can be identified. Note that currently only linking between two components (a pair of chromosomes) is determined.
The relaxation option is used to estimate the robustness of the topology of a given chromosome or pair of chromosomes. The change in the conformation of the chromosomes is investigated via molecular dynamics, described here, and the criterion to determine the robustness of the topology is described here. Results for relaxation (Fig. 3) is presented as follows:
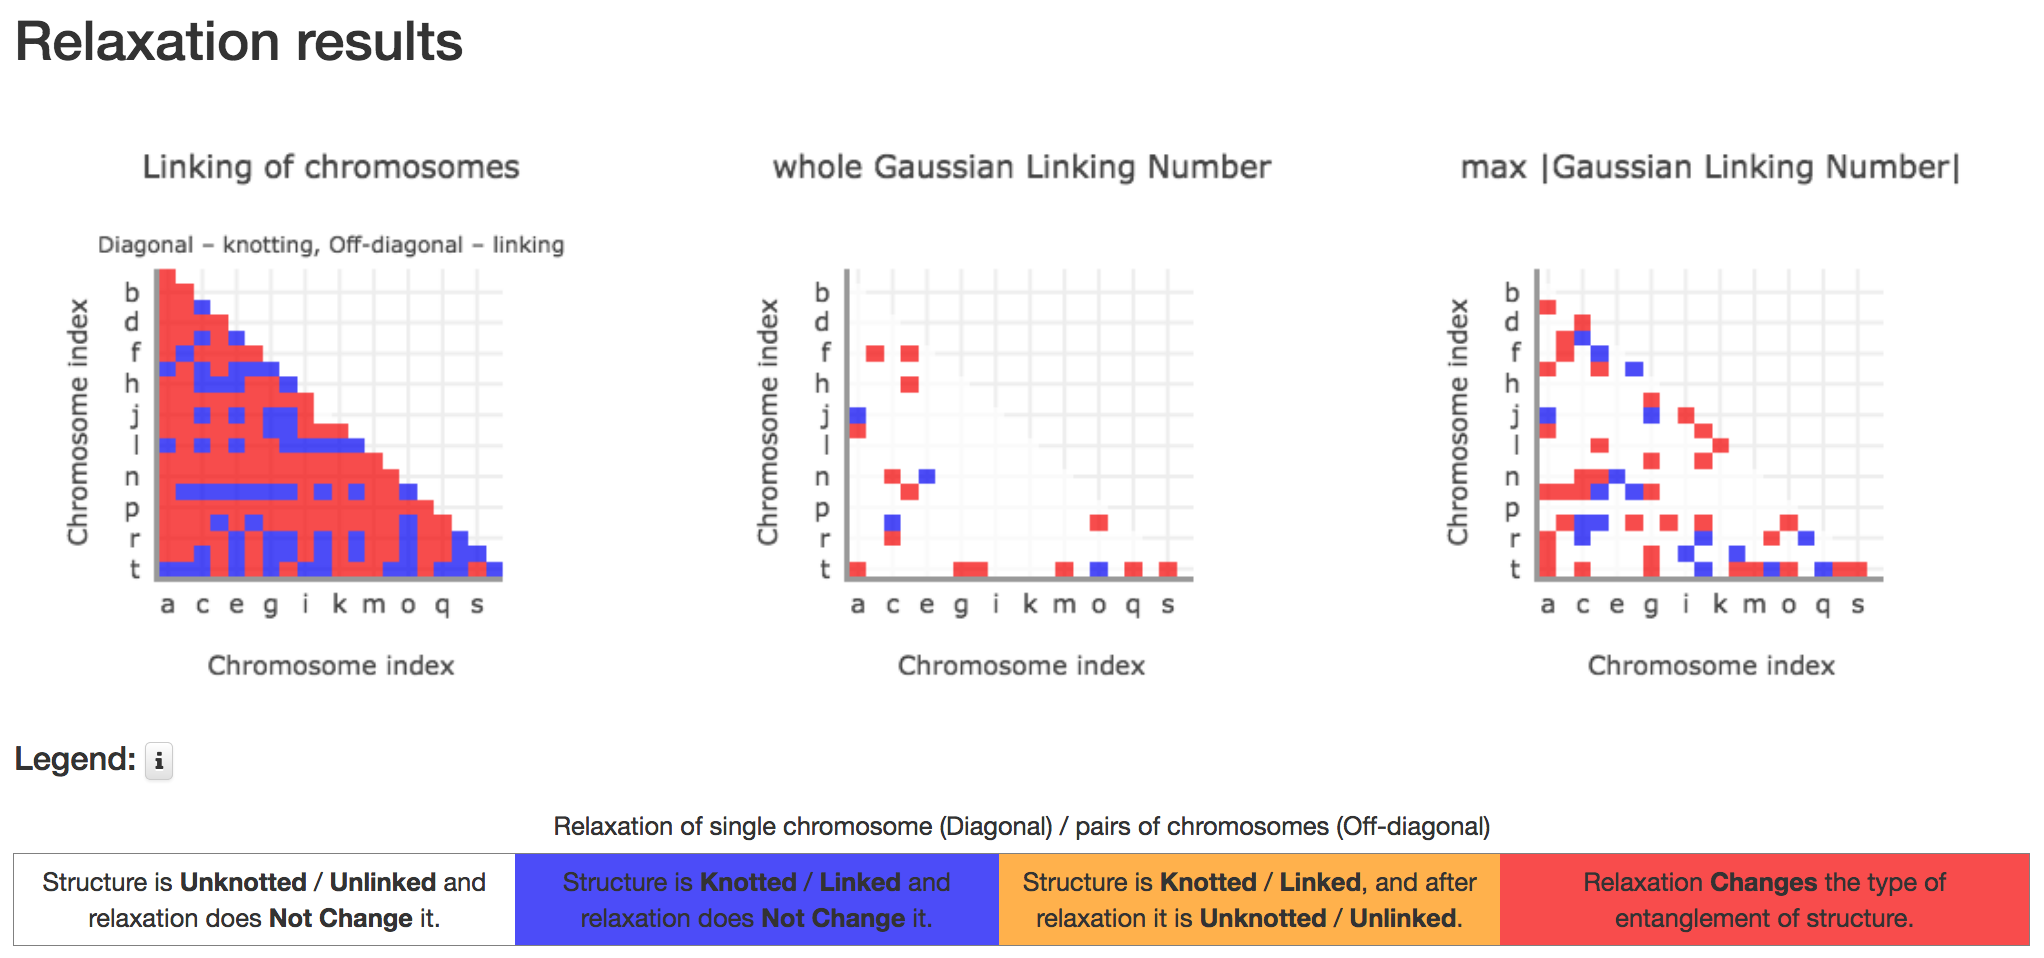
Fig. 3 Overview of the result page for many pairs of chromosomes (in this case: 20 pairs) relaxation analysis. These results suggest that in the majority of cases the knot and link type have been changed.
The robustness of topology (knotting and linking) of all investigated chromosomes is presented via interactive matrices as shown in Fig. 3.
When the number of analyzed chromosomes is bigger than 5, matrices are shown via miniature images which, upon clicking, are shown on the full screen, Fig. 4. Upon pointing on a matrix element, some details about topology with an annotation of chromosomes names are displayed. Clicking on the element of the matrix causes opening of a subpage with the detailed description of temporary topology of an individual chromosome (see single chromosome relaxation example) or a pair of chromosomes, as described below.
Remarks: this color code allows for easy and fast interpretation of the robustness of all analysed structures. Since the GLN is a different method to characterize entanglement, compositions of all matrices together further facilitates topological analysis.
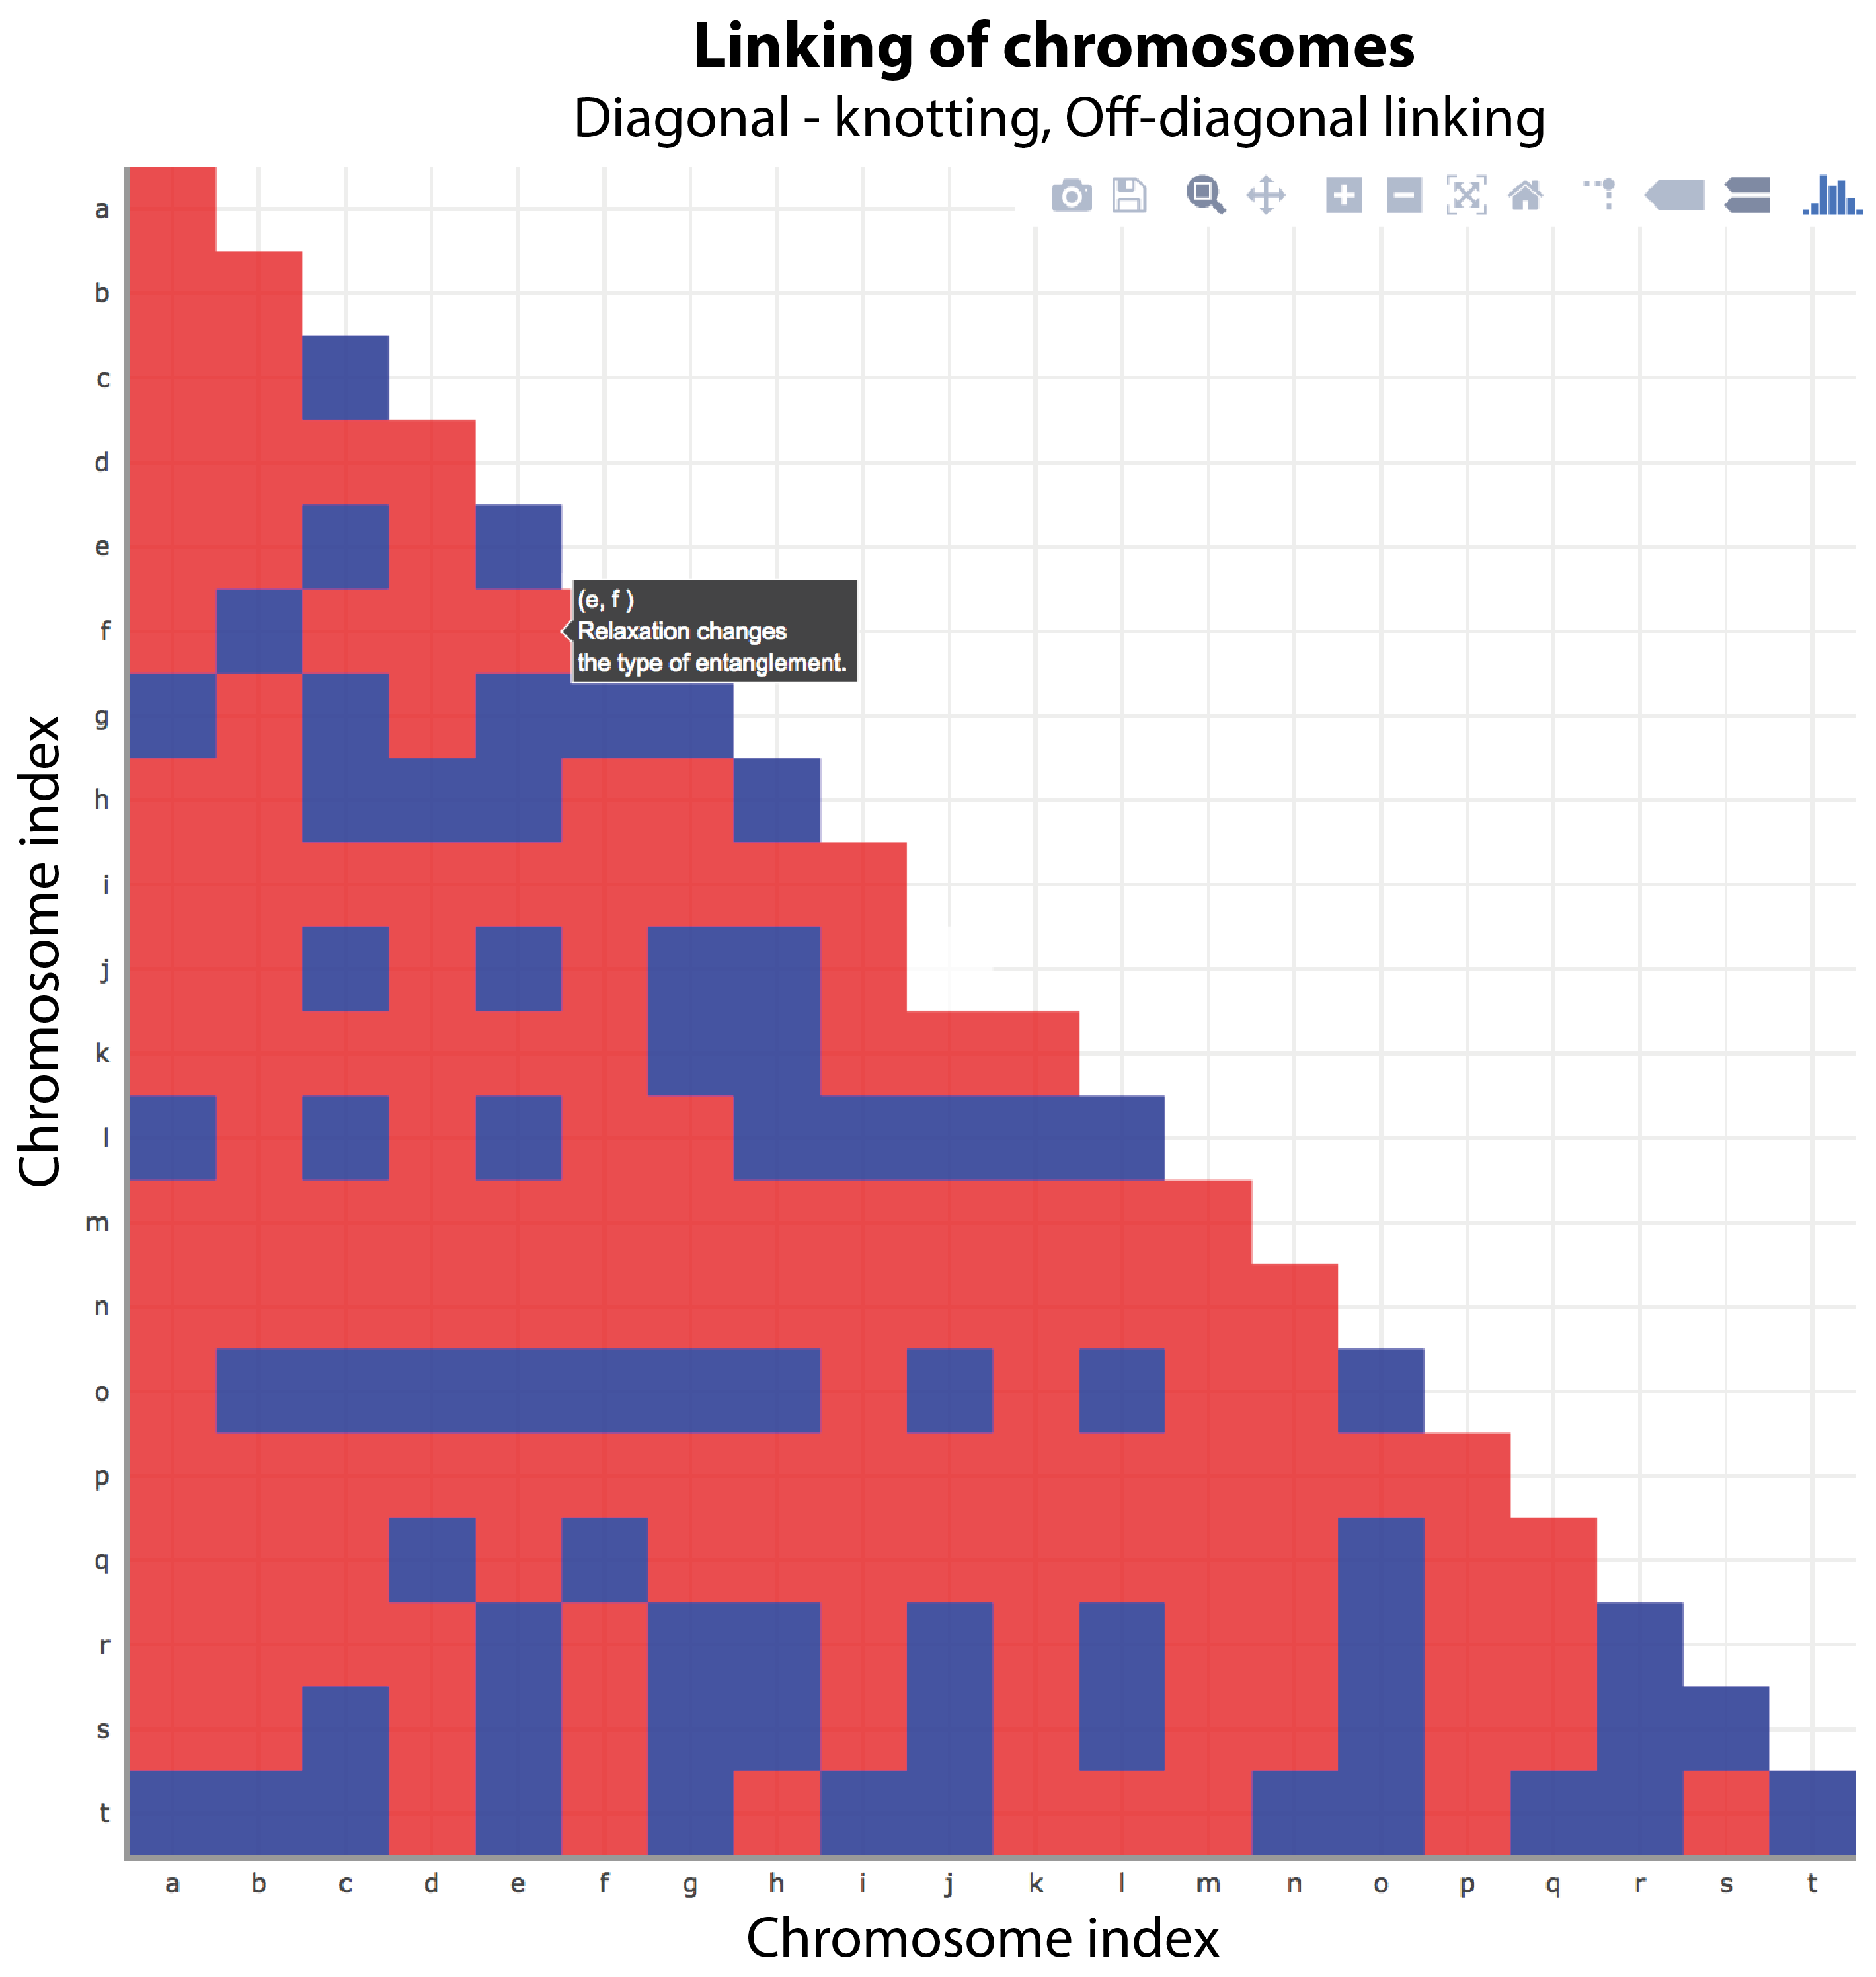
Fig. 4 Matrix Linking of chromosomes presents the robustness of the topology of each single chromosome (elements on the diagonal) and pairs of chromosomes (off-diagonal elements) via four colors based on a criterion described here.
The result of relaxation - the robustness of an investigated topology - is described via four colors and presented at the top of the page (subpage) in the box called "Relaxation results":
The robustness of the topology is estimated based on the type of the topology identified in temporary conformations. The table 1 presents details of identified topologies in the original conformation, and middle and last frames, which were used to estimate the robustness of topology. The knot table contains the knot type, its schematic drawing, and probability of identified topology. The link table contains the link type, its schematic drawing, probability of identified topology, and whGLN, max|GLN| and maxshort|GLN|.
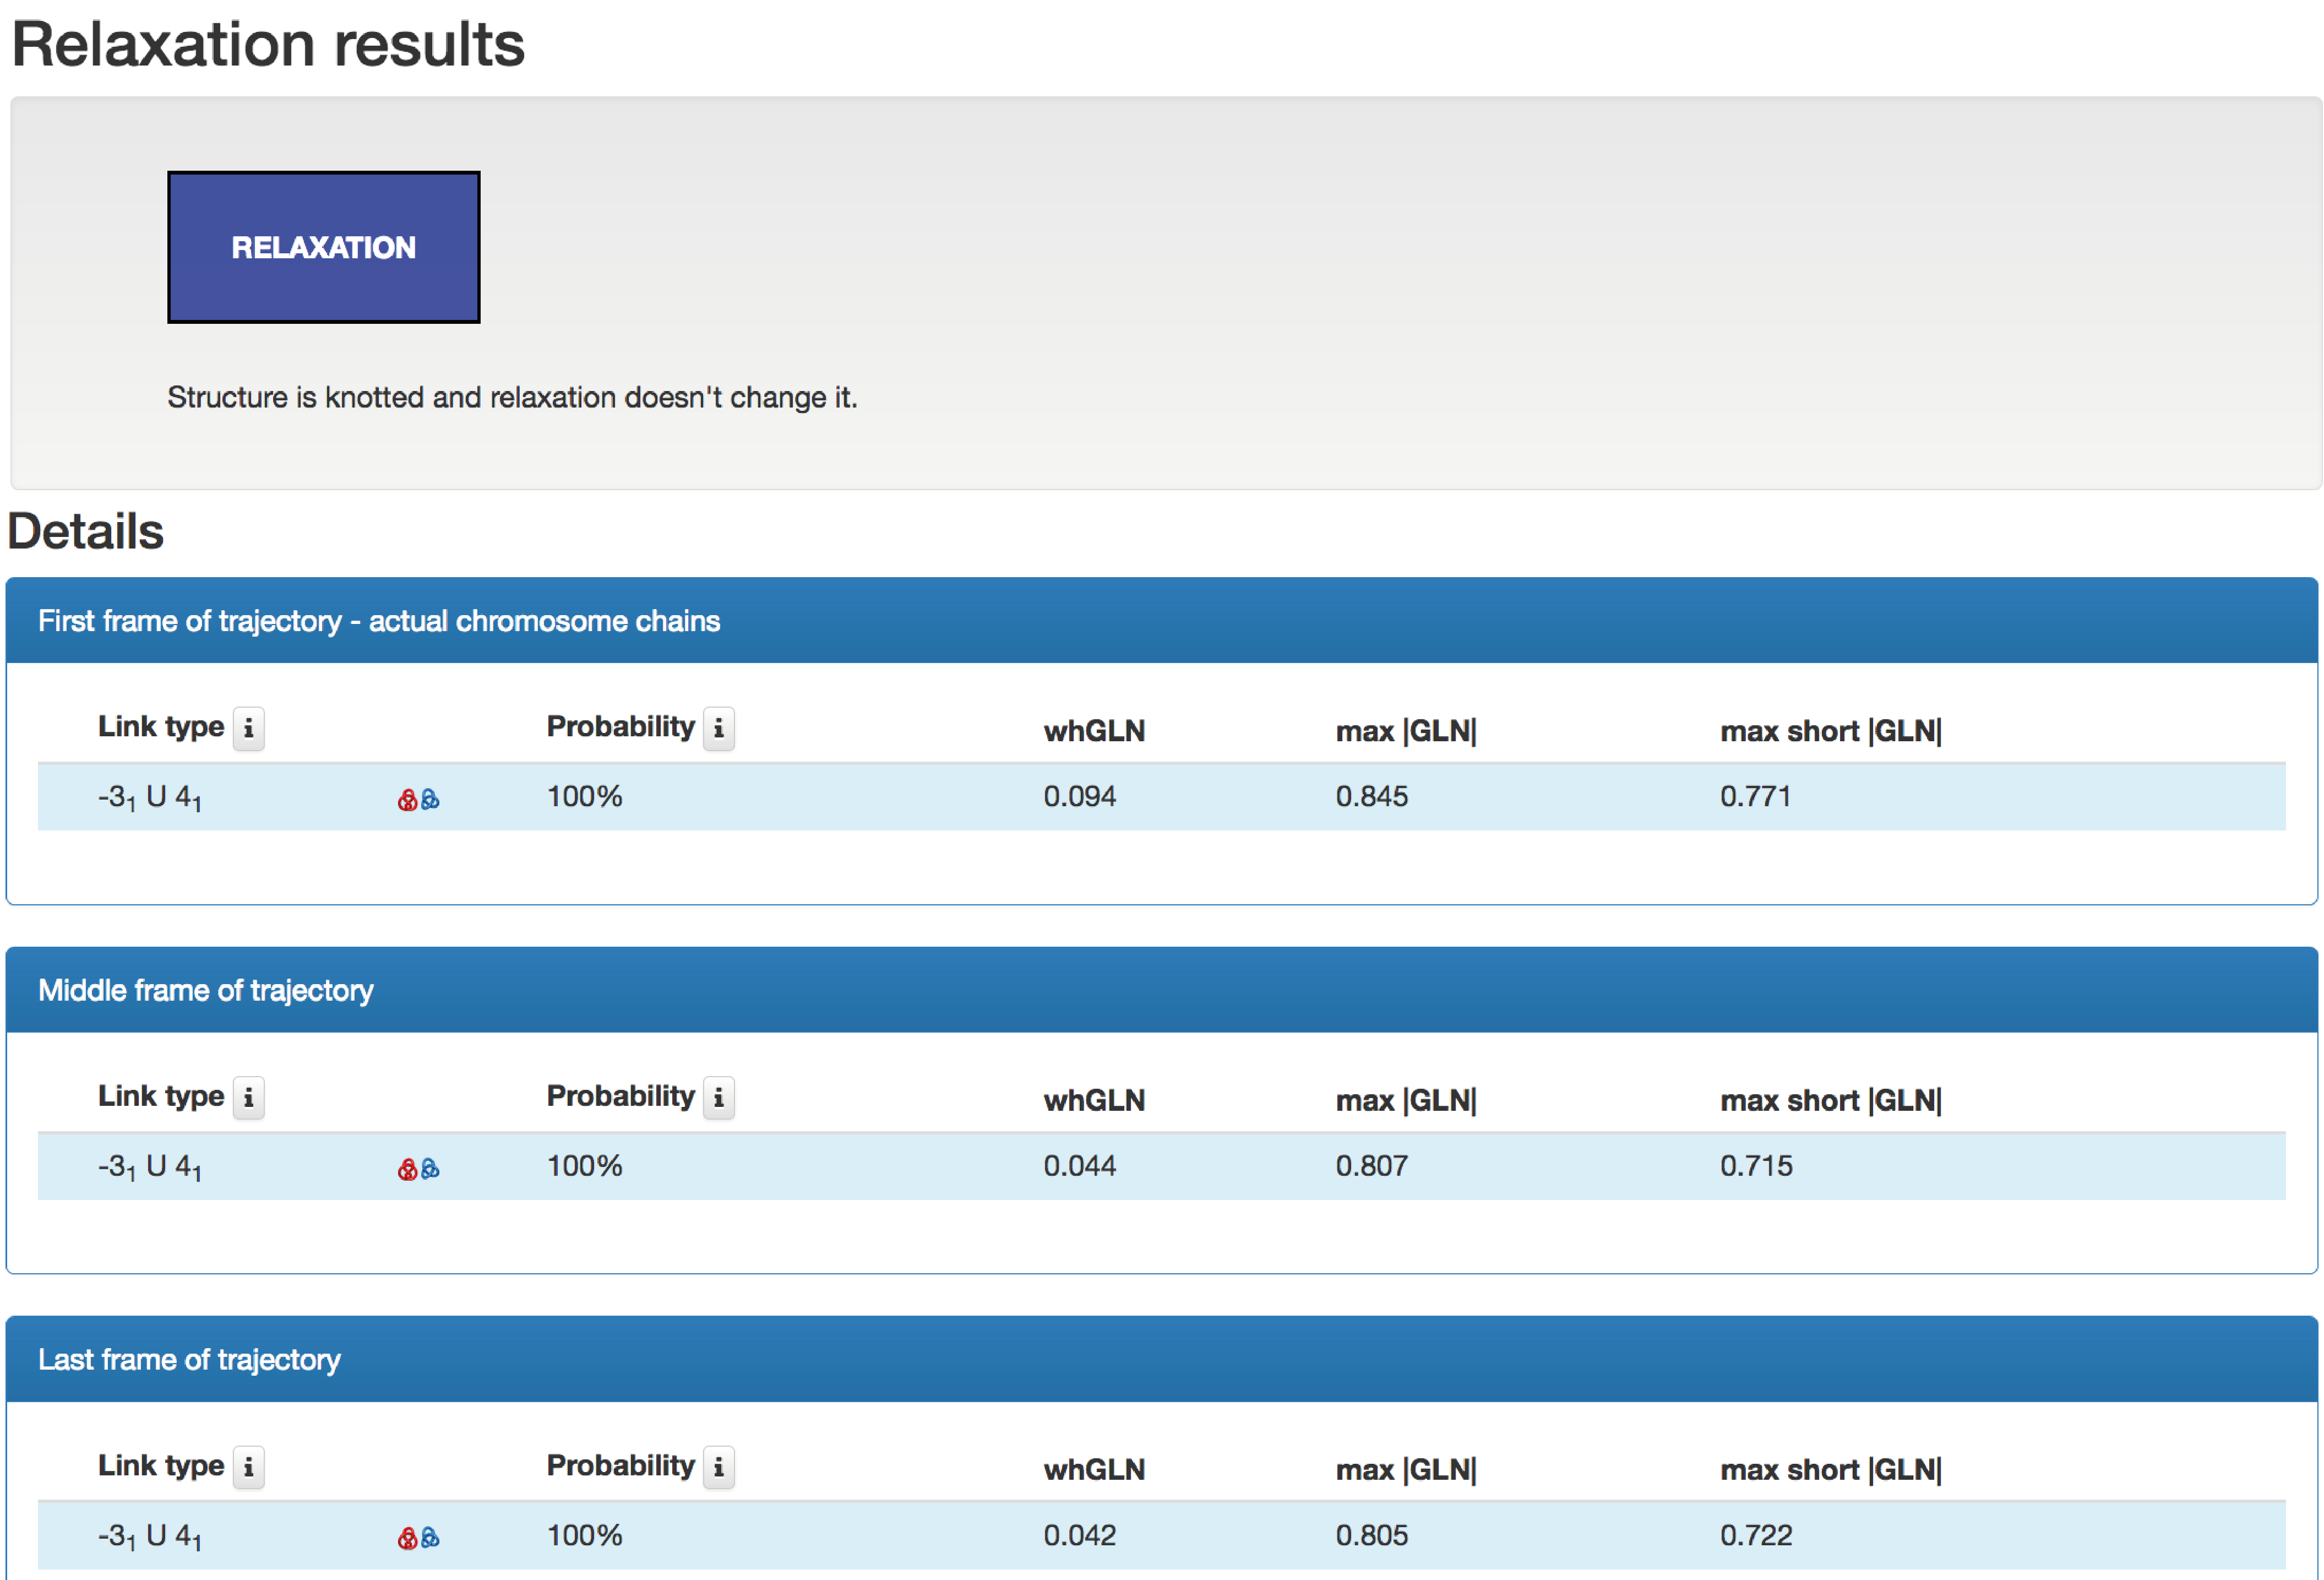
Table 1 Overview of a subpage with results when more than one chromosome is analyzed. The top panel presents type of the robustness of the topology. Three frames below show identified topology in the first (the original structure), middle and last frame of molecular dynamics simulation. These results suggest that this pair of chromosomes is unlinked during the entire simulation and the topology of each single chromosome remains the same.
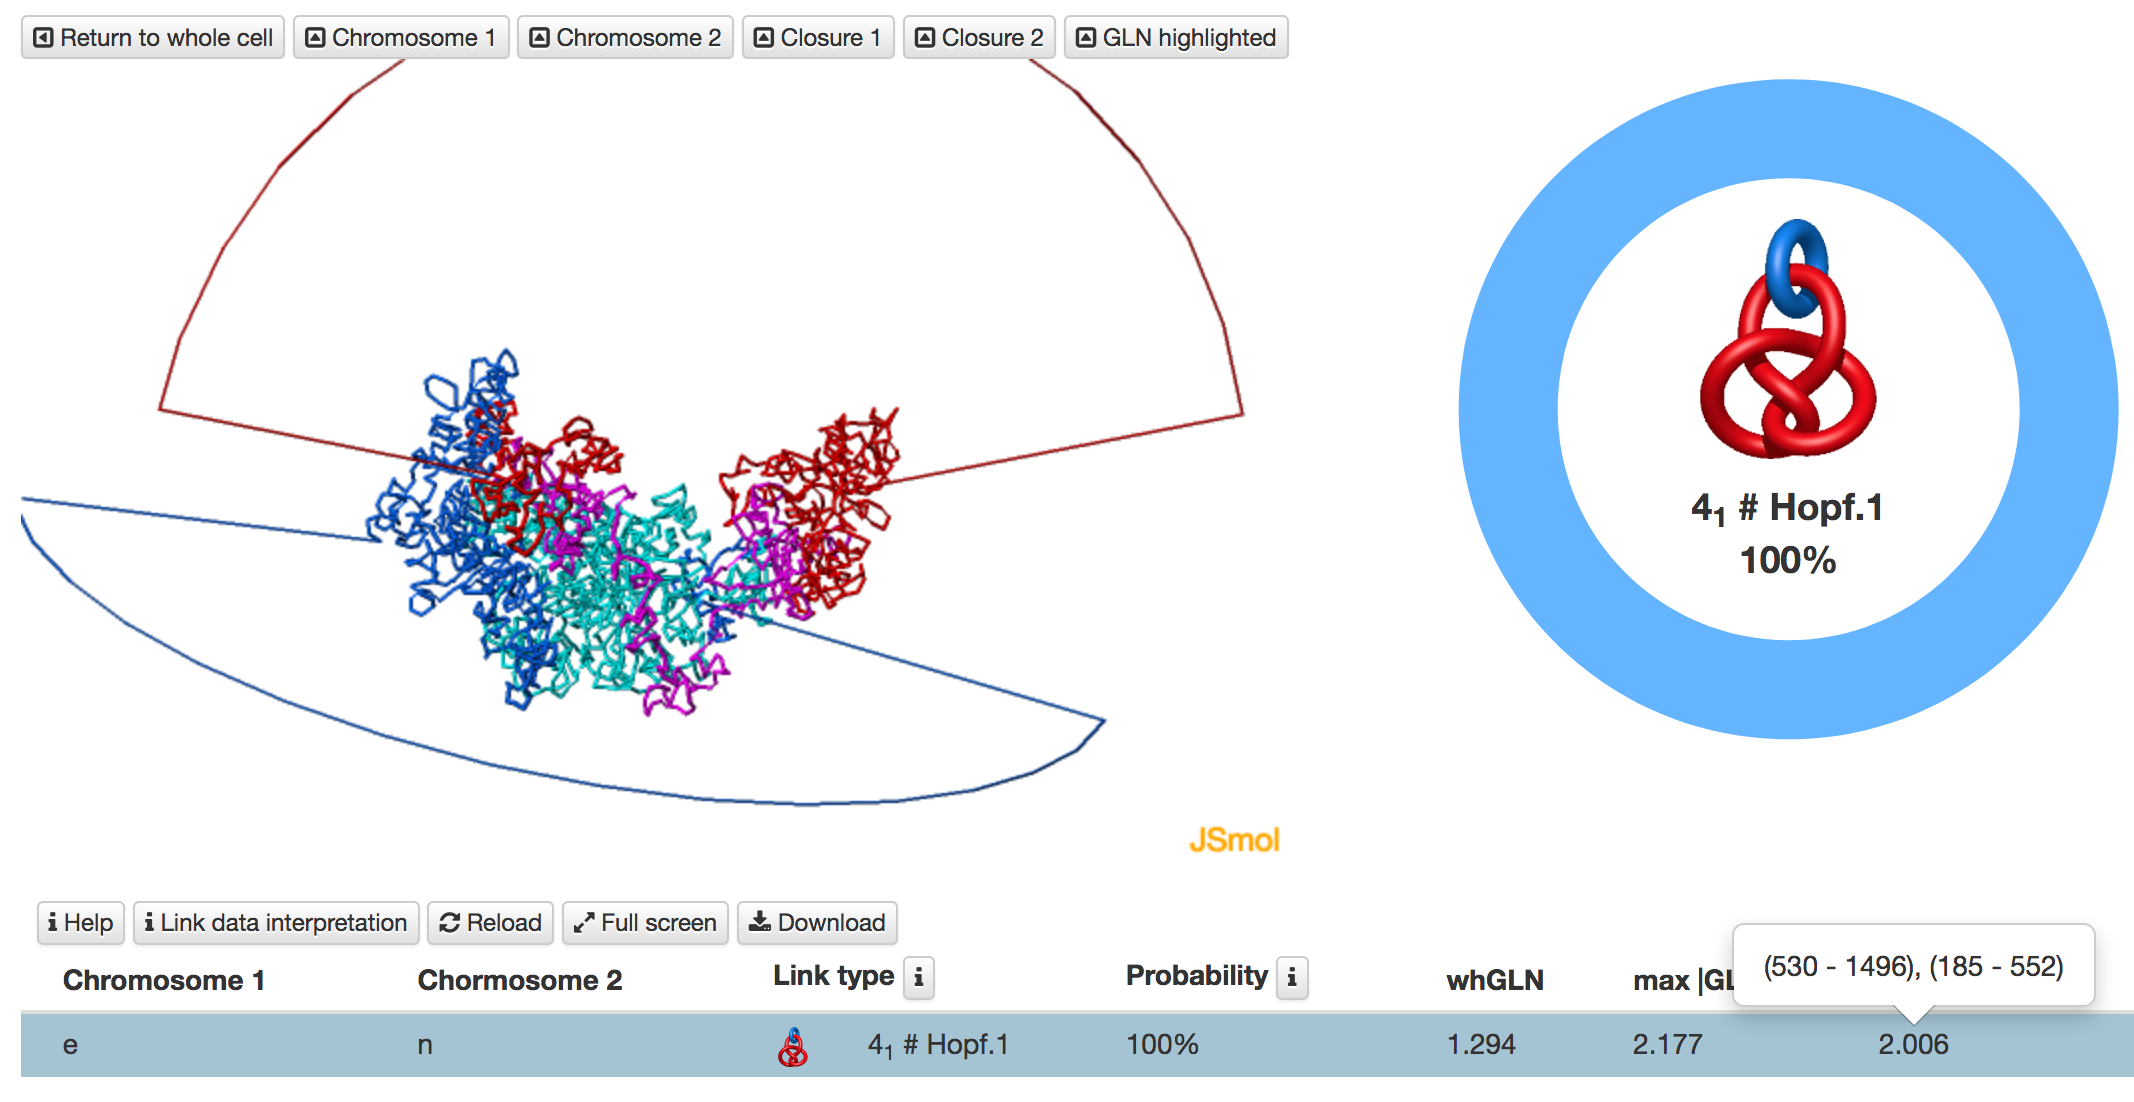
Fig. 5 An example of analysis of a pair of chromosome structures based on the deterministic method. These chromosomes form a Hopf.2 link, where one of the chromosomes is knotted. The knot table located above link table can be used to identify which of the chains is knotted.
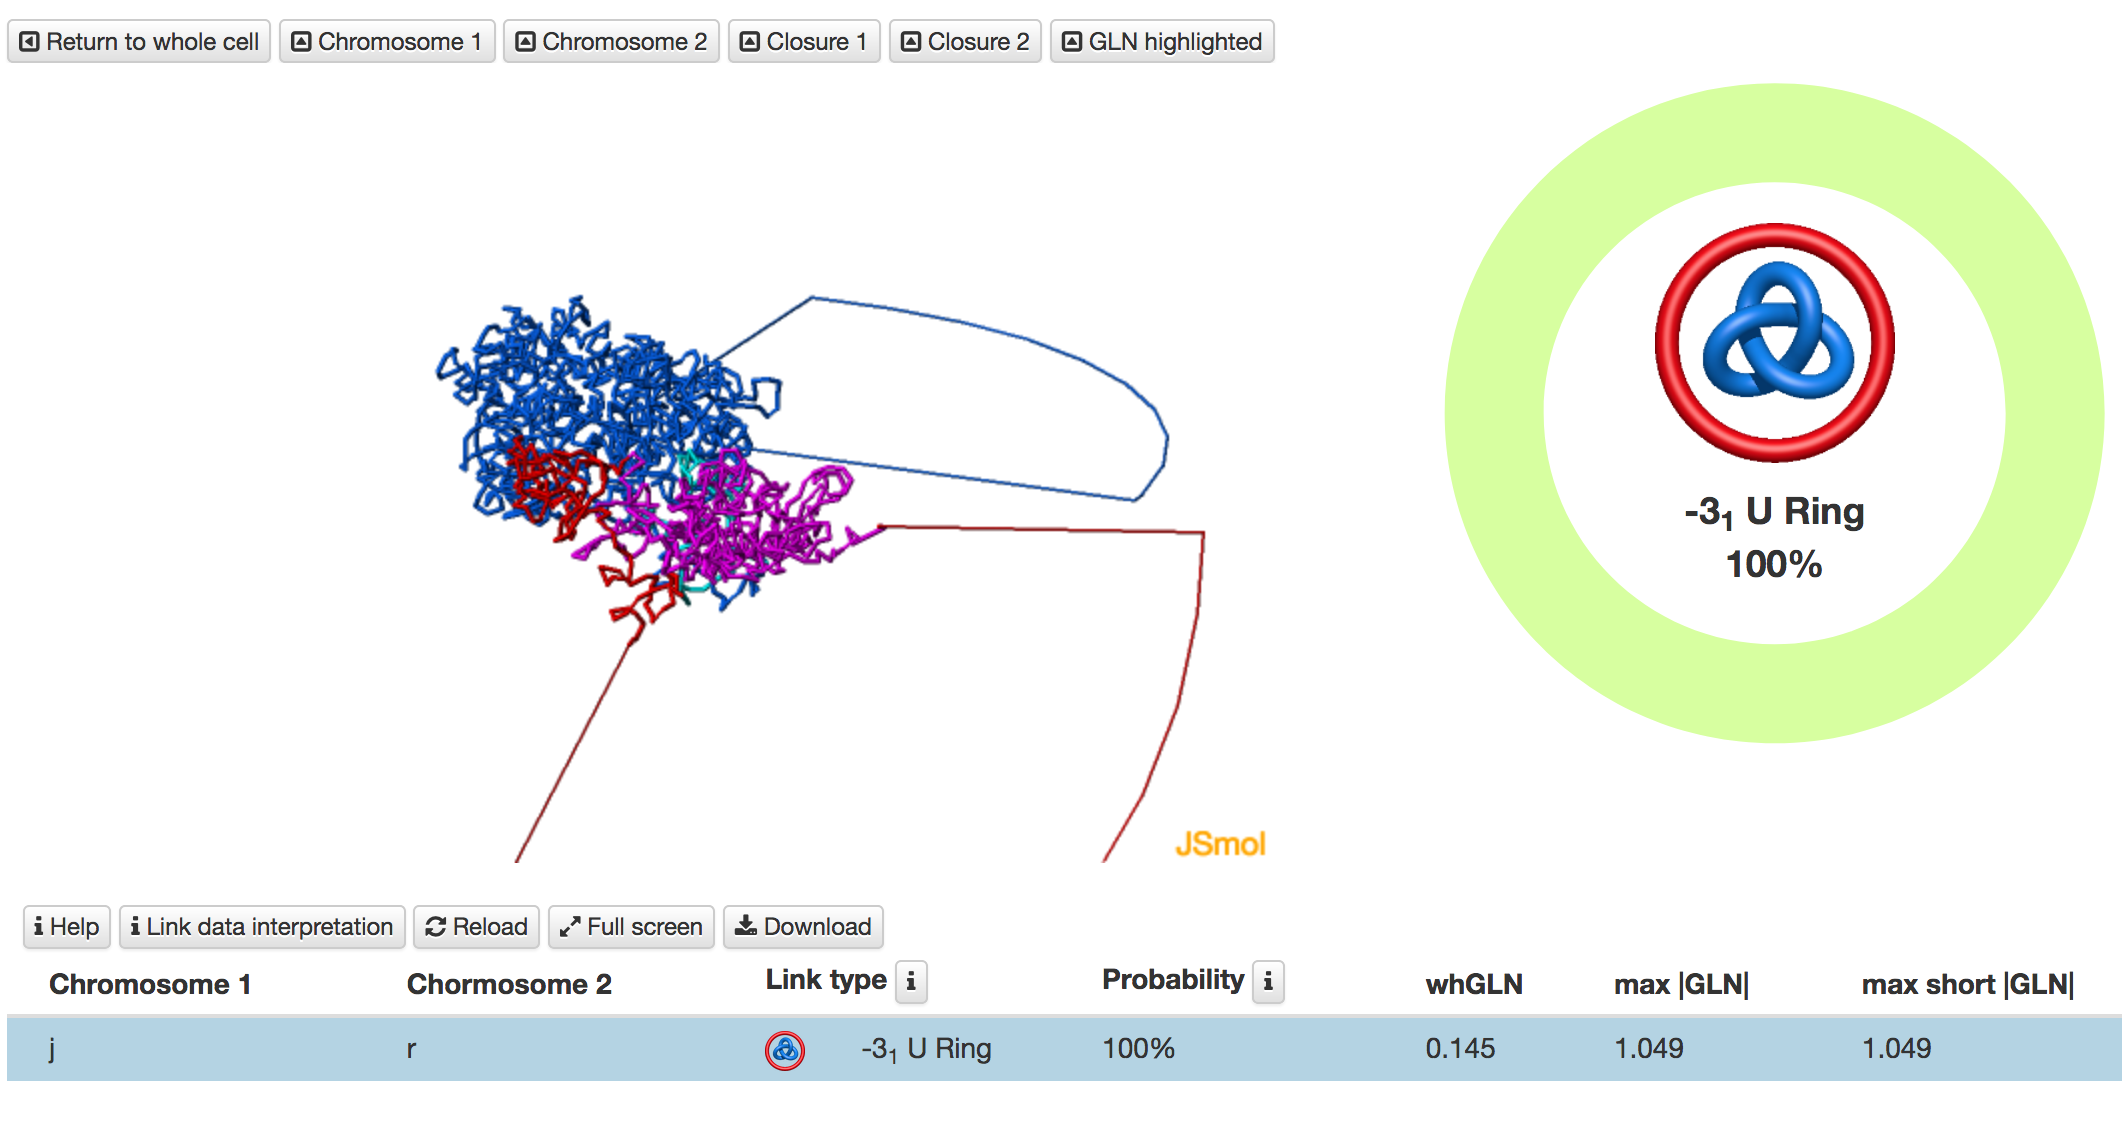
Fig. 6 An example of analysis of a pair of chromosome structures based on the deterministic method. These chromosomes are unlinked, however, one chromosome forms a 31 knot.
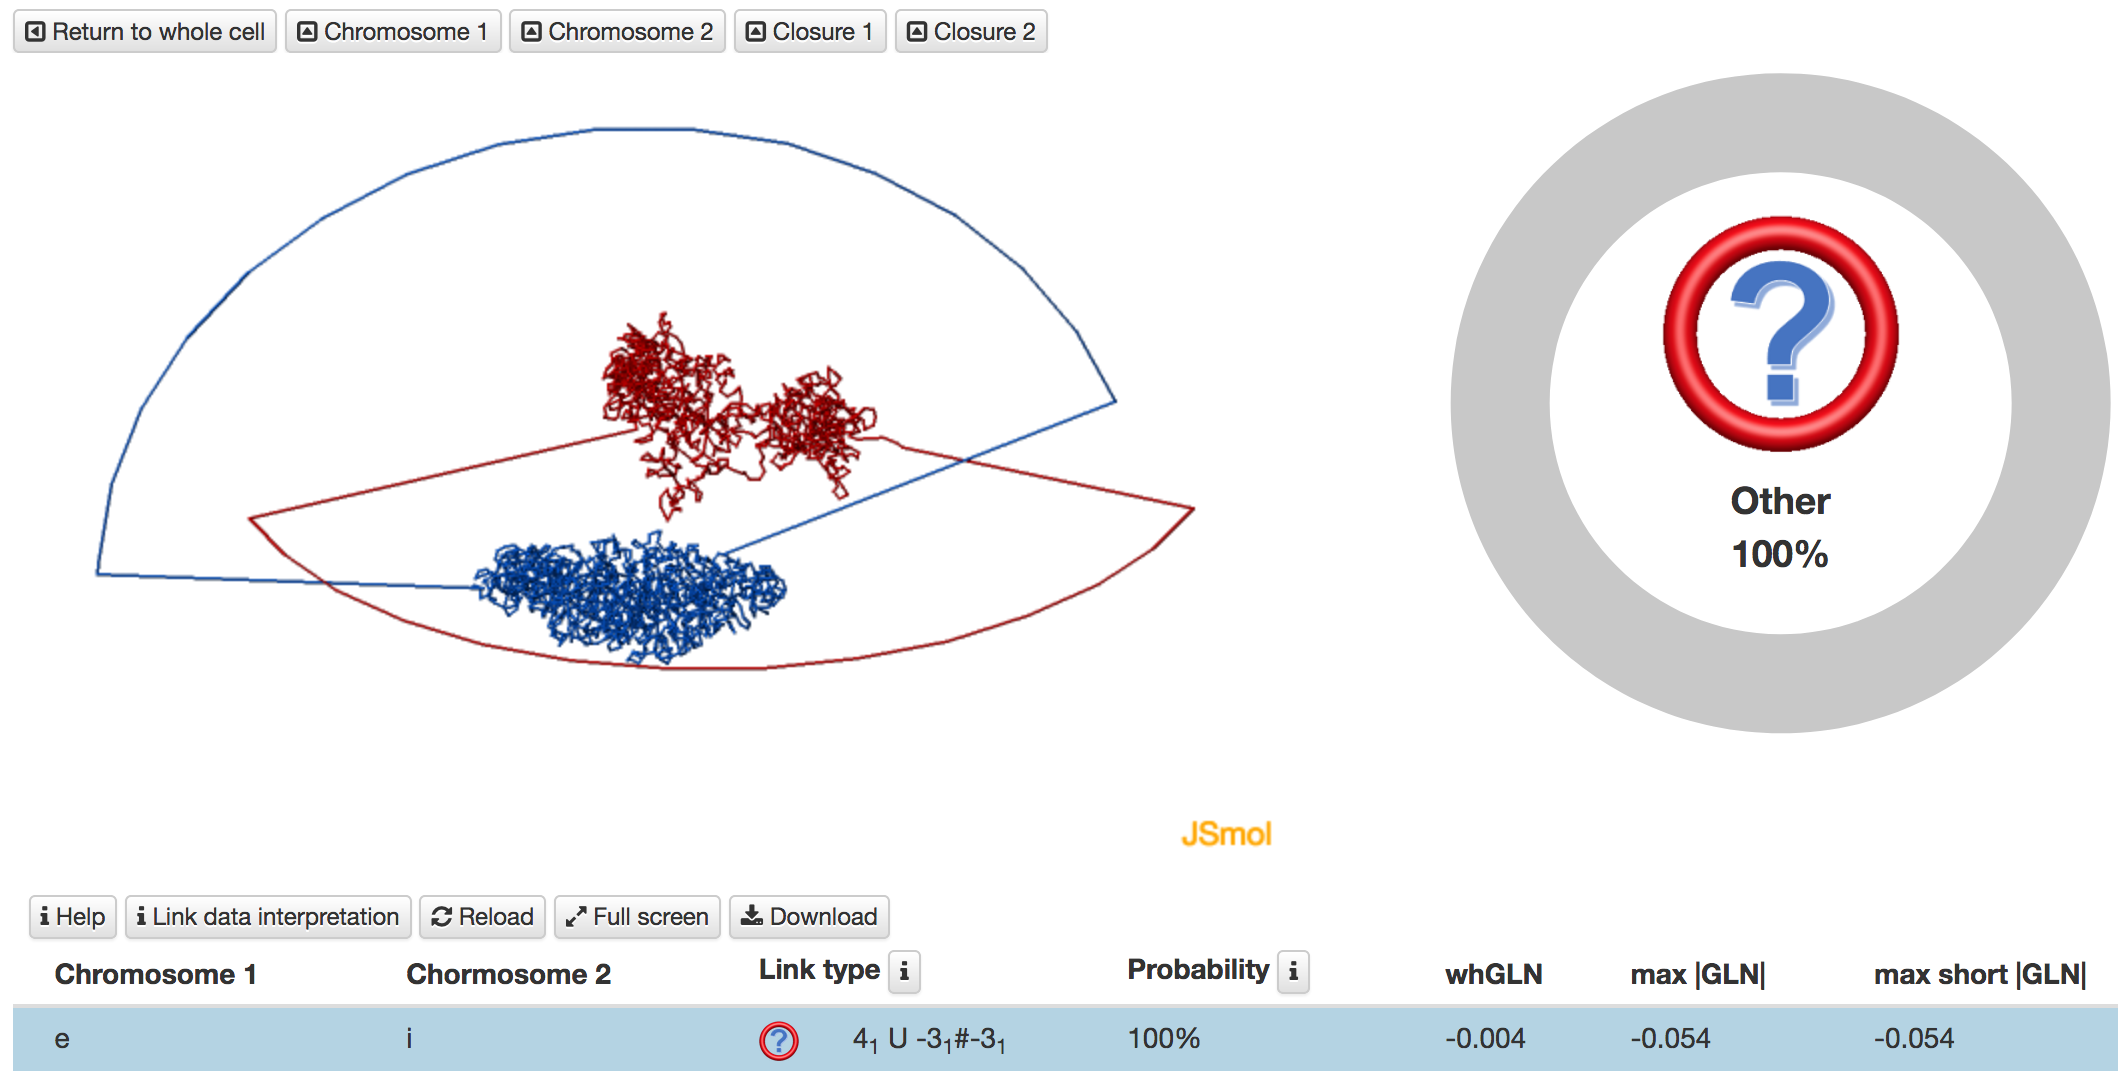
Fig. 7 An example of analysis of a pair of chromosome structures based on the deterministic method. These chromosomes are unlinked, however, each single chromosome is knotted. The knot table located above the link table should be used to assigned the type of knotting to each chromosome.